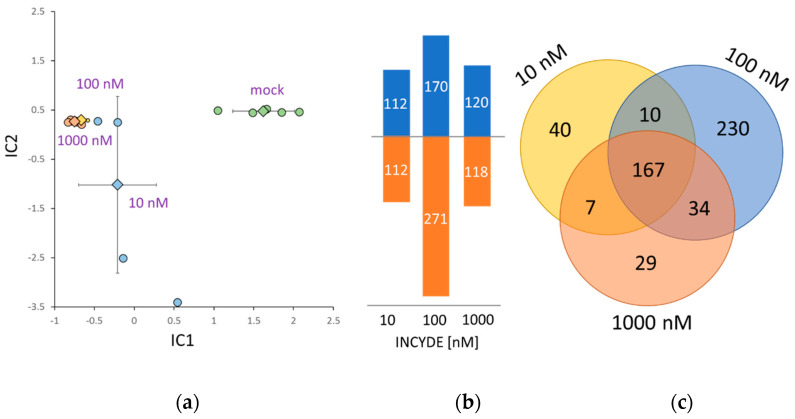
Figure 5.
Dose-dependent INCYDE response of Arabidopsis proteome. (a) The proteome profile separation of INCYDE- and mock-treated samples. Independent component analysis based on quantitative data of 1500 most abundant proteins. Results of five biological replicates, including means and standard deviation; (b) Accumulated (blue) and decreased (orange) INCYDE-responsive proteins; (c) Overlap between the differentially-abundant proteins found in response to indicated INCYDE concentrations. For details, see Supplementary Table S3.

