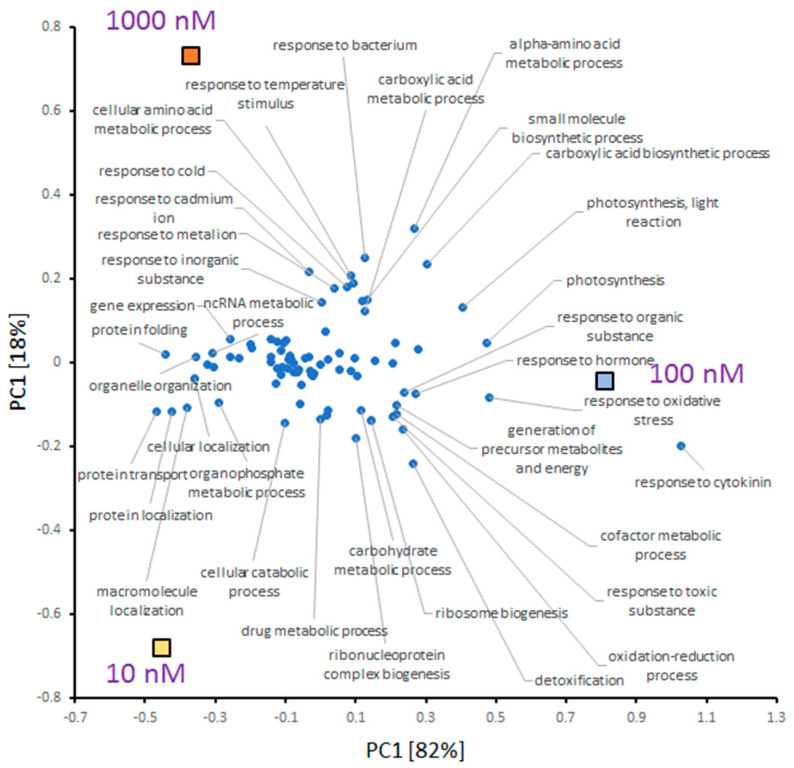
Figure 6.
Comparison of enriched biological processes in INCYDE-responsive proteomes. For the sake of clarity, categories with at least 15 proteins were included in the final analysis, and only GO terms with the most significant contribution to the separation in PC1 or PC2 are labeled. The separation of individual treatments (represented by boxes) indicates a similarity between 10 and 1000 nM samples.

