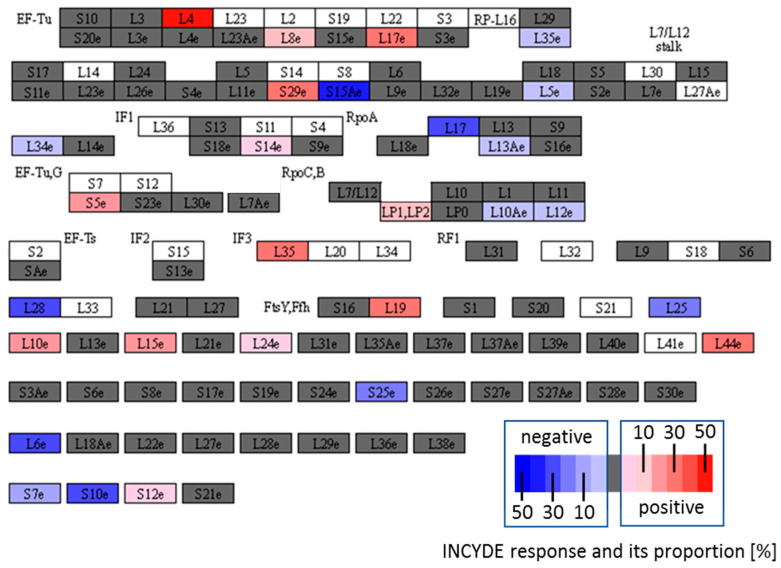
Figure 9.
INCYDE response ribosomal proteins. A graphical representation of all identified ribosomal subunits in shoots of plants exposed to INCYDE for 168 h. Annotated using the KEGG Mapper [45]. Blue and red gradients indicate subunits with one or more INCYDE-responsive paralogs. The contribution of the paralog to the subunit composition [%] is indicated; white—not detected; grey—no significant difference compared to the mock-treated plants.

