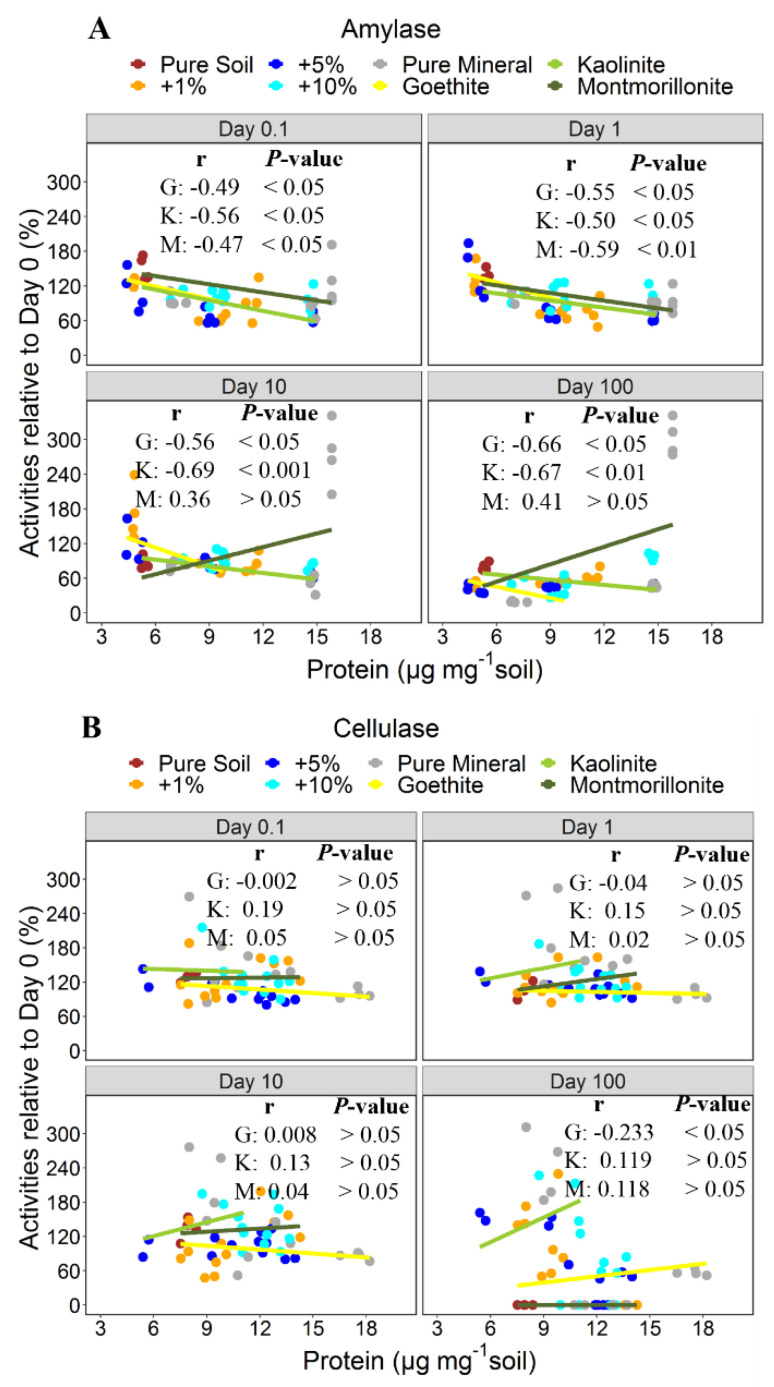
Figure 5.
Persistence of activities of amylase (A) and cellulase (B) normalized to the amount adsorbed protein. Points represent the persistence of activities in the pure soil, the mineral additions variants, and the pure minerals (n=4). Lines indicate trends in relationships with the protein contents based on types of minerals. G = goethite, K = kaolinite, and M = montmorillonite.

