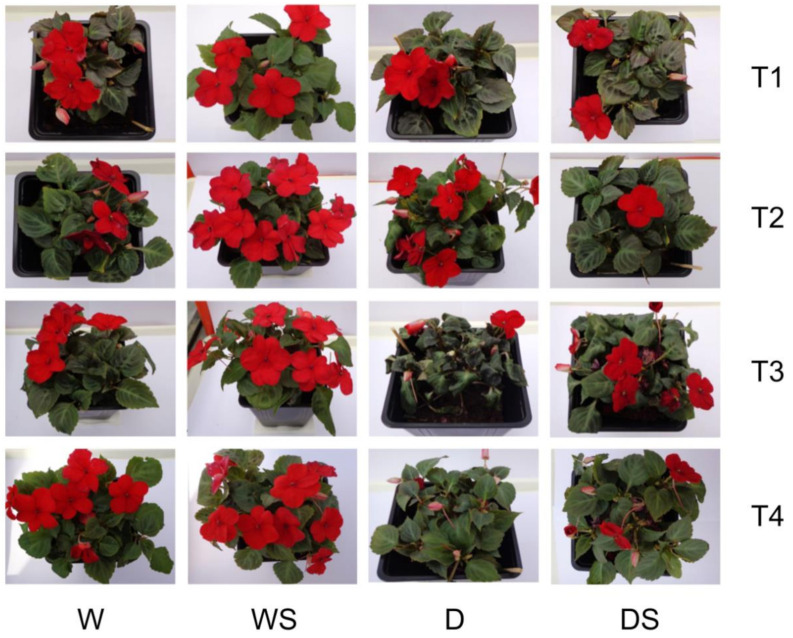
Figure 2.
Appearance of the four test groups of plants at different time points. watered plants (W); drought-stressed plants (D); watered plants treated with salicylic acid (SA) (WS); drought-stressed plants treated with SA (DS). T1–T4 are different time points as indicated in Figure 1.

