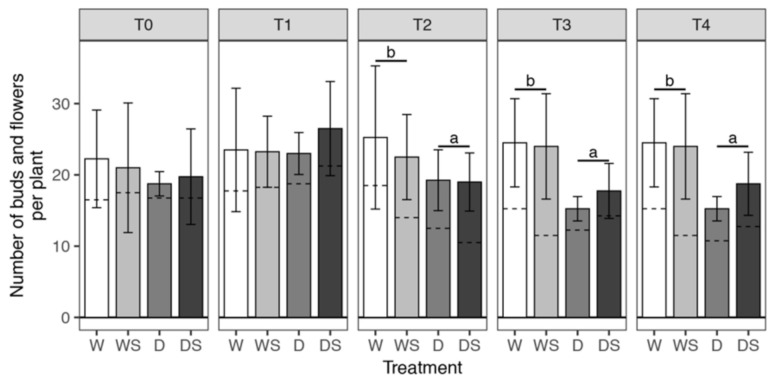
Figure 3.
Average number of flower buds and flowers developed per plant. Error bars represent standard deviation of four biological replicates (four plants) T0–T4 are different sampling points (see Figure 1). watered plants (W); drought-stressed plants (D); watered plants treated with SA (WS); drought-stressed plants treated with SA (DS). The average number of flower buds is indicated by the lower part of the bars, below the dashed lines, while the upper part of the bars corresponds to the average number of open flowers. The total number of buds and flowers was modeled within each sampling time (T0–T4) using Poisson regression with log link. Dehydration was shown to have a statistically significant effect at T2, T3 and T4 (Table S2). Pairwise comparisons of estimated marginal means were conducted at these time points for the effect of dehydration (W + WS group compared to the D + DS group); p-values obtained from these comparisons were adjusted jointly using the FDR method and significant differences between groups (p < 0.05) are shown with a compact letter displayed above the bars.

