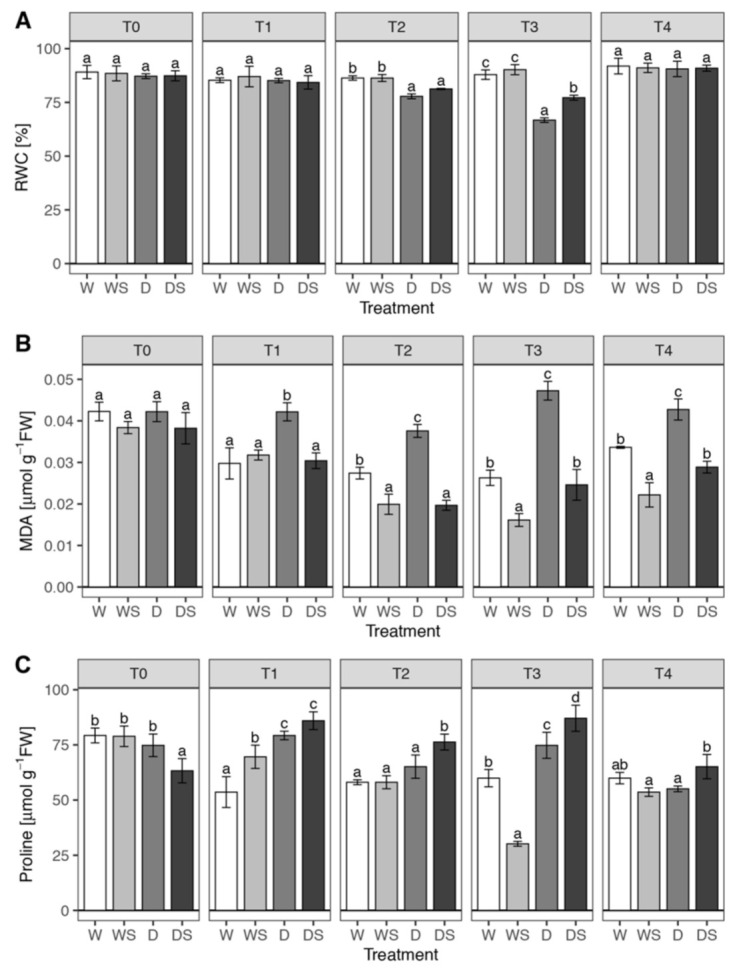
Figure 4.

Changes in relative water content (RWC) (A), malondialdehyde (MDA) (B), and Proline (C) in Impatiens plants under drought stress and in response to SA. Watered plants (W); drought-stressed plants (D); watered plants treated with SA (WS); drought-stressed plants treated with SA (DS). T0–T4 are different sampling points (see Figure 1). Each bar represents the average RWC, MDA or proline of three biological replicates. Variation between biological replicates is indicated by error bars representing standard deviation. The data was analyzed using factorial analysis of variance (ANOVA, Tables S5, S6 and S7). The effect of the three-way interaction dehydration:SA:time was significant on each dependent variable, so pairwise comparisons of estimated marginal means were conducted within each sampling time (T0–T4) using Tukey’s method and significant differences (p < 0.05) are indicated by a compact letter displayed above the bars.
