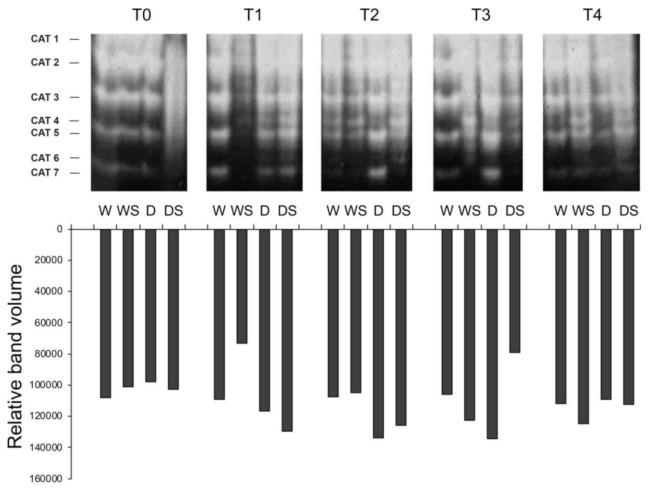
Figure 6.
Zymograms of catalase (CAT) isoforms. Total soluble proteins isolated from leaves (35 μg protein/lane) of watered plants (W), drought-stressed plants (D), watered plants treated with SA (WS) or drought-stressed plants treated with SA (DS) were separated by native PAGE and assayed for CAT activity. T0–T4 are different sampling points (see Figure 1). Total CAT activities are represented by bars.

