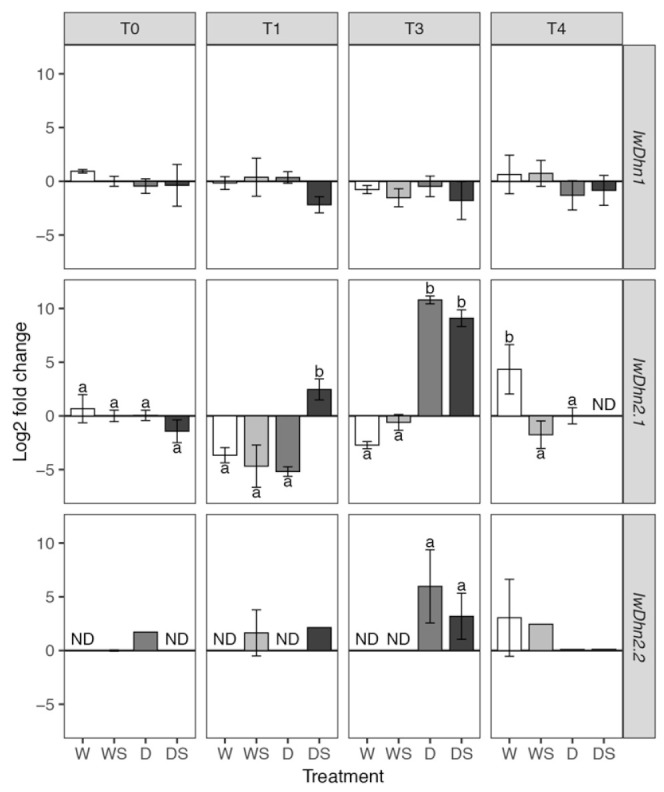
Figure 9.

Relative expression of three I. walleriana dehydrins determined by quantitative real-time polymerase chain reaction (RT-qPCR). Groups of plants are labeled as W, WS, D and DS, while T0–T4 are sampling time points (see Figure 1). Means and standard deviations are shown for three biological replicates. ND—expression was not detected. IwDhn1 and IwDhn2.1 data was analyzed using factorial ANOVA: only drought stress had a slight but statistically significant effect on IwDhn1 relative expression (Table S8) so multiple comparisons between different treatments were not conducted. The effect of the three-way interaction dehydration:SA:time on the relative expression ofIwDhn2.1 was highly statistically significant (Table S9) so pairwise comparisons of estimated marginal means were conducted within each sampling time (T0–T4) using Tukey’s method and significant differences (p < 0.05) are indicated by a compact letter displayed above the bars. For IwDhn2.2 statistical comparison was conducted between D and DS treatments at T3 using Welch’s t-test.
