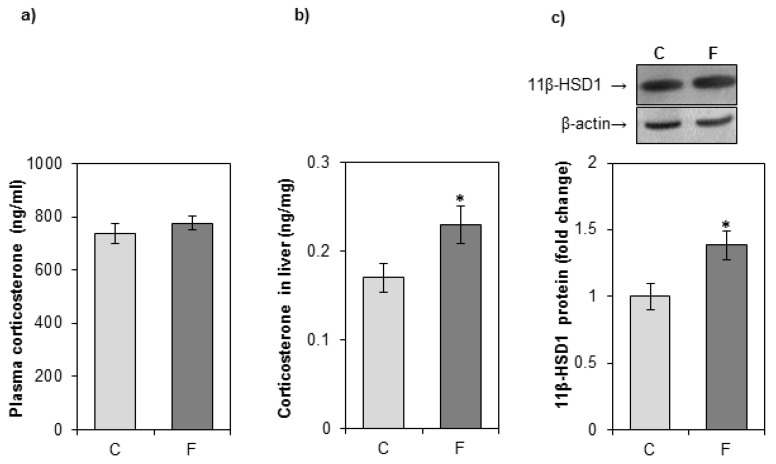
Figure 1.
The effects of a fructose-rich diet on plasma and liver corticosterone concentrations, and the level of hepatic 11βHSD1. Groups: control (C), fructose-fed (F). Corticosterone concentrations in plasma (a) and liver (b) were measured by EIA kit. 11βHSD1 protein level in hepatic microsomal fraction (c) was measured by Western blot. Relative integrated optical density of the immunoreactive bands was assessed by ImageQuant software, normalized to β-actin, and expressed as fold of the control. The values represent the means ± SEM (n = 9). Statistical significance of differences between experimental groups: * p < 0.05.

