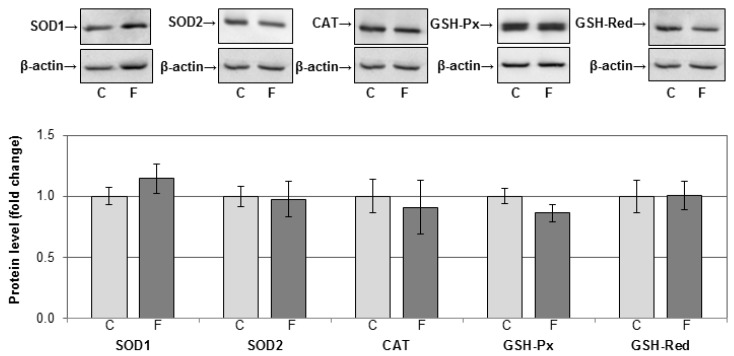
Figure 7.
The effects of a fructose-rich diet on the level of antioxidant enzymes in the liver. Hepatic whole cell extracts (50 µg protein) were subjected to SDS-PAGE and Western blotting. Relative integrated optical density was assessed by ImageQuant software. β-actin was used as loading control. Representative Western blots and relative quantification of antioxidant enzyme protein levels of control (C) and fructose-fed rats (F) are shown. Values are means ± SEM (n = 9) and are presented as fold of the control. SOD1, cytoplasmic copper-zinc superoxide dismutase; SOD2, mitochondrial manganese superoxide dismutase: CAT, catalase; GSH-Px, glutathione peroxidase; GSH-Red, glutathione reductase.

