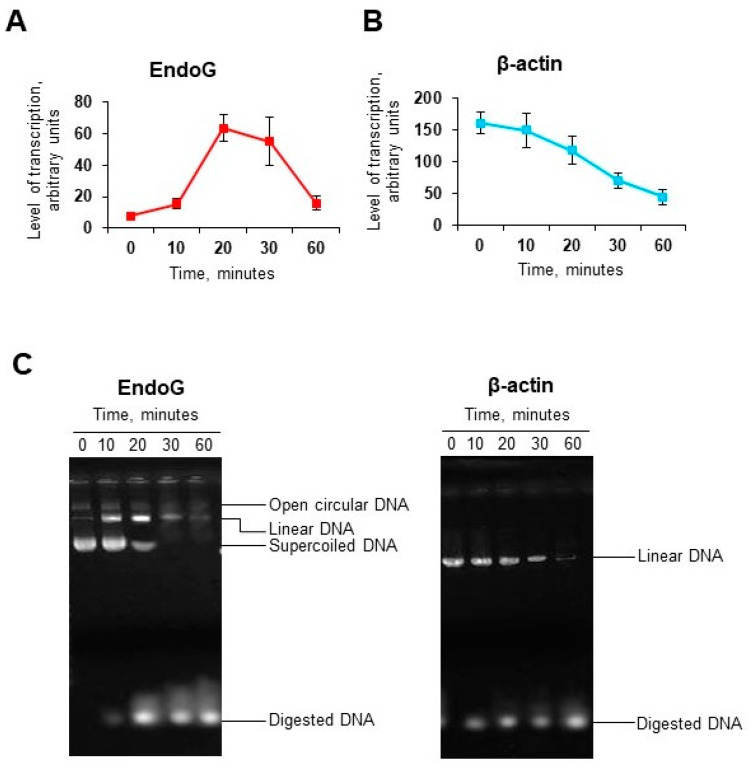
Figure 7.
In vitro transcription of mouse EndoG (A) and mouse beta-actin (B) genes in plasmid constructs cleaved with recDNase I. mRNA expression was measured by real-time RT-PCR. Arbitrary units reflect coefficient of dilutions from 1:40 to 1:320 that were applied to the standard curve (n = 4). (C) Gel electrophoresis shows digestion of pET29b-mEndoG and pTRI-β-actin plasmids by recDNase I (Pulmozyme).

