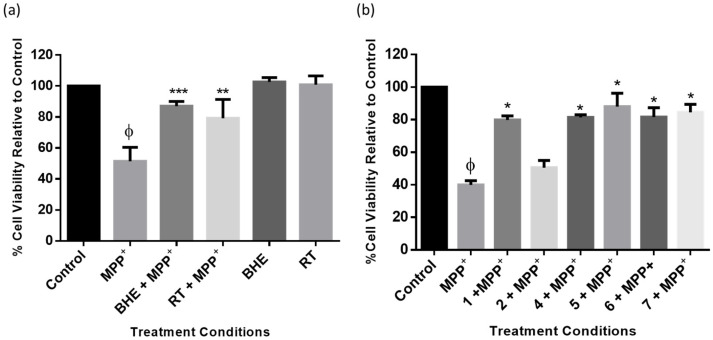
Figure 6.
BHE and compounds show protection in SH-SY5Y cells. Cells were pre-treated with extracts (a) and compounds (b) before exposure to MPP+ for 24 h. Each bar represents mean percentage cell viability relative to control, and significance of difference indicated with * (p < 0.05), ** (p < 0.01), and *** (p < 0.001) when extract/compounds are compared to MPP+ and ϕ (MPP+ vs. control).

