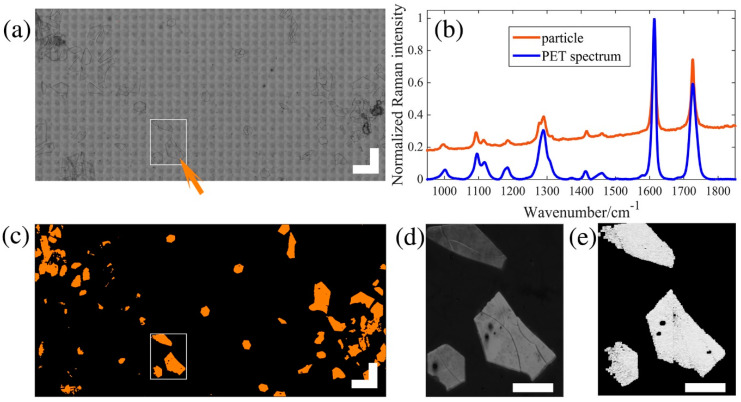
Figure 7.
Stimulated Raman scattering (SRS) and Raman mapping of a nail polish extract. The tile scanned white light image of the measured area is shown in (a); scale bar: 500 μm. A particle (indicated by the orange arrow) in this image was measured with conventional Raman for confirmation, and its spectrum is shown in (b); orange spectrum, particle). The blue curve is a Raman reference spectrum of polyethylene terephthalate (PET) for comparison. In the SRS overlay image (c), five binary versions of the five identification images were color coded and overlaid as follows: PET: orange; Nylon: red; polystyrene: green; and polypropylene and polyethylene were not found; scale bar: 500 μm. (d) is a spontaneous Raman mapping from the area marked with a white square in (a) and (c), fitted with direct classical least squares to a reference spectrum of PET. (e) is the same area of the PET identified image with SRS, with greyscale values indicating the identification scores. Scale bars in (d,e): 200 μm [56].

