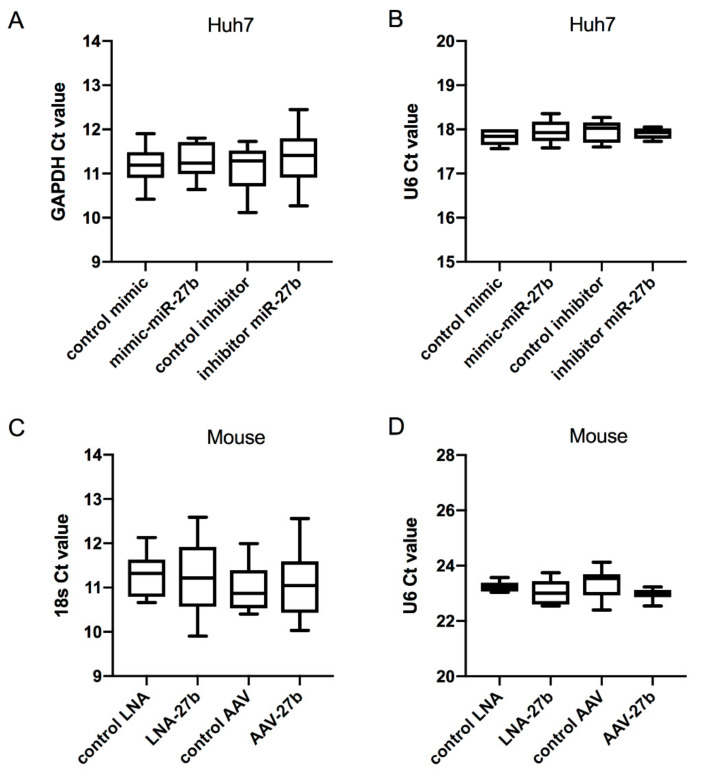
Figure A1.
Comparison expression levels of the selected housekeeping RNA molecules: (A) GAPDH in Huh7 cells, p = 0.204, ANOVA; (B) U6 in Huh7 cells, p = 0.661; (C) 18s in mouse, 18S p = 0.464; and (D) U6 in mouse, p = 0.139. One-way analysis of variance (ANOVA) was used to determine whether a significant difference in GAPDH, 18s and U6 values existed between multiple groups.

