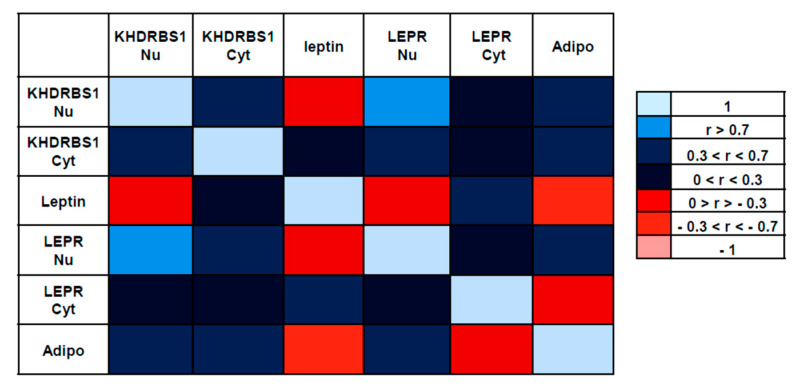
Figure 7.
Pairwise Pearson correlation matrix for IHC expression of KHDRBS1, leptin, LEPR, and adiponectin. The blue boxes represent variables that have a positive relationship, while the red boxes represent variables that have a negative relationship. The lighter the box, the closer the correlation is to one, negative or positive. KHDRBS1 Nu: nuclear KHDRBS1; KHDRBS1 Cyt, cytosolic KHDRBS1; LEPR Nu, nuclear leptin receptor; LEPR Cyt, cytosolic leptin receptor; Adipo, adiponectin.

