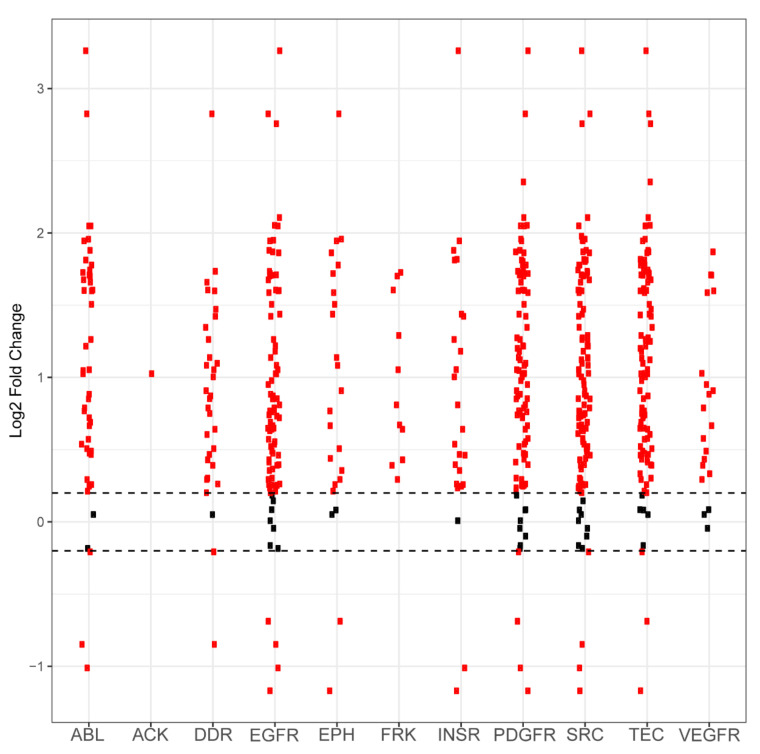
Figure A1.
Differential phosphorylation levels of peptide sequences attributed to kinase family activity in PANC1 vs. wild-type control. Each red dot in a column represents one peptide sequence whose phosphorylation is performed by that column’s kinase family. The y axis reports log2-fold change and the x axis identifies the kinase family. Black dots represent peptides that did not demonstrate differential phosphorylation in PANC1 samples compared to wild-type samples, with the dashed horizontal line representing a positive or negative 0.2 log2-fold change cutoff. Red dots above these lines represent peptides that are more phosphorylated in PANC1 compared to control. Red dots that are below these lines represent peptides that are less phosphorylated in PANC1 compared to control.

