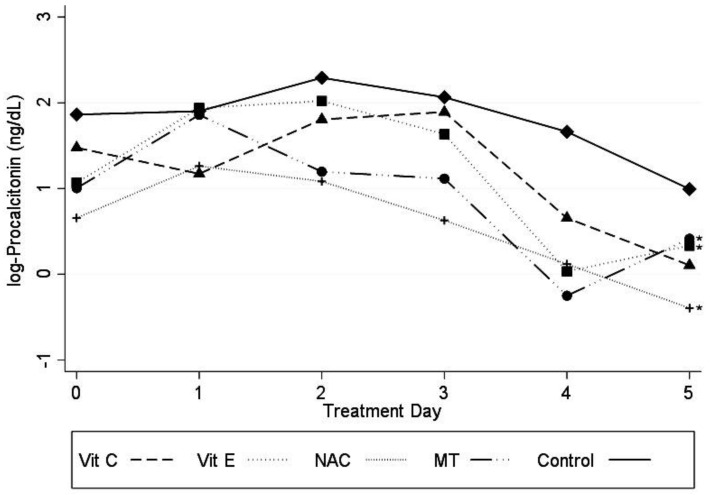
Figure 4.
Log PCT concentration in the plasma from patients of the experimental groups with the different antioxidant treatments. Abbreviations: Log PCT = logarithm of procalcitonin, Vit C = vitamin C, Vit E = vitamin E, NAC = n-acetylcysteíne, MT = melatonin. Marginal approximation model considering the control group as a base: Vit C −0.43 (−1.03 to 0.15; p = 0.149); Vit E −0.59 (−1.18 a −0.006; p ≤ 0.05); NAC −0.92 (−1.48 to −0.35; p = 0.001); MT −0.57 (−1.15 to 0.006; p = 0.05); Cons 1.46 (1.05 to 1.86); * p ≤ 0.05.

