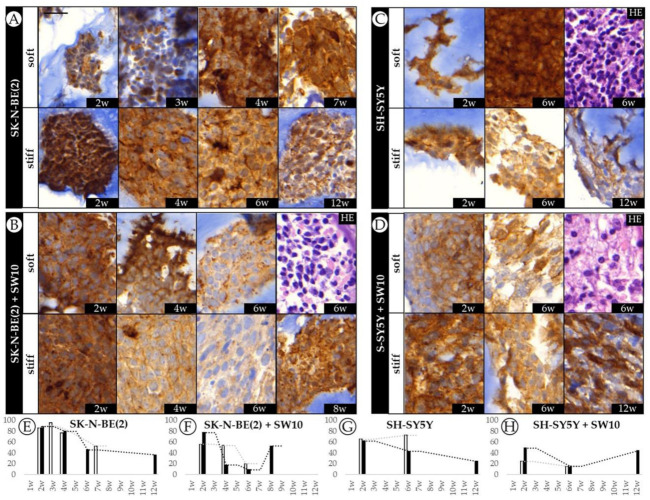
Figure 4.
Dynamics of VN expression in SK-N-BE(2) and SH-SY5Y cell lines over time. (A–D) Representative images of VN expression at the time points studied (w: weeks) and hematoxylin eosin (HE) for each cell culture/co-culture in soft and stiff scaffoldings. The images on the left correspond to the SK-N-BE(2) cell line cultivated (A) alone and (B) with SW10; the images on the right represent the SH-SY5Y cell line cultivated (C) alone and (D) with SW10 cells. Scale bar 25 µm at top left of the first image. Same scale bar is valid for all images. (E–H) Bar chart quantification of VN staining (% of stained area) for SK-N-BE(2) cells (E) alone and (F) SK-N-BE(2) cells plus SW10 cells in soft and stiff scaffolds, and SH-SY5Y cells (G) alone and (H) S-SY5Y cells plus SW10 cells in soft and stiff scaffolds. White and black bars: soft and stiff scaffolds, respectively. Dashed lines indicate moving average per stiffness condition. X axis: time in weeks (w) and Y axis: % of VN stained area.

