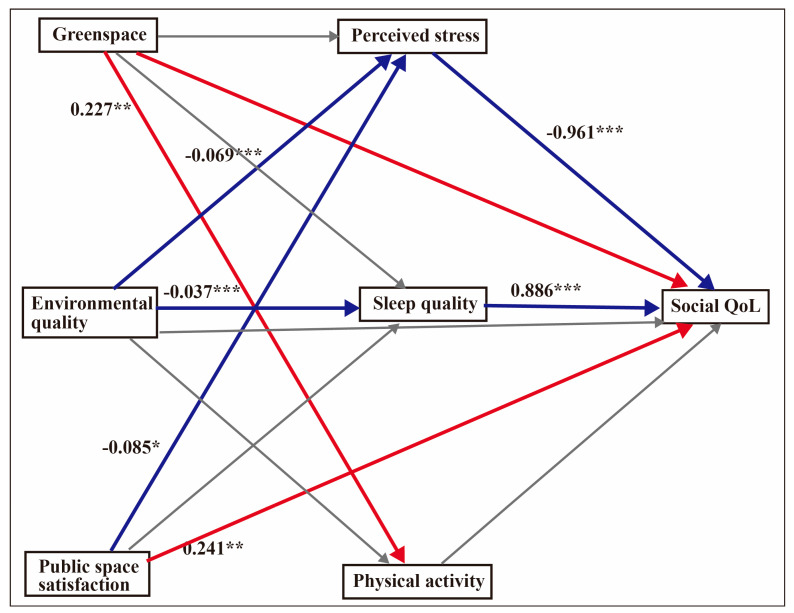
Figure 3.
Mediation model for social QoL. The analyses controlled for fruit intake, vegetable intake, gender and chronic illness. Unstandardised coefficients are displayed. The values indicate the strength of the relationship between variables. Red arrows depict positive relationships, blue arrows show negative relationships and grey arrows depict non-significance. * p < 0.05, ** p < 0.01, *** p < 0.001.

