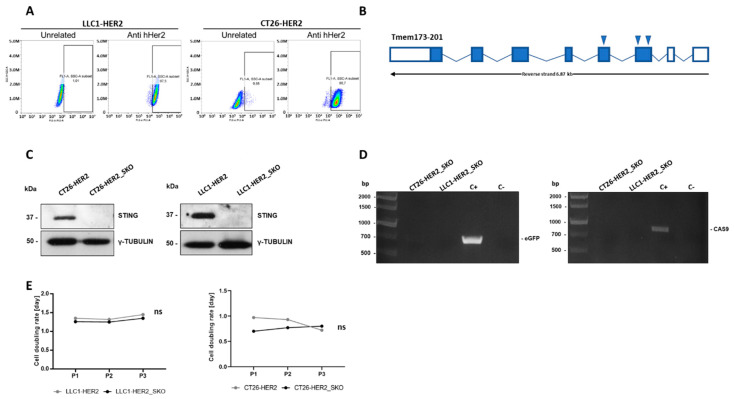
Figure 1.
Molecular characterization of Sting knockout cancer cell lines. (A) Analysis of human HER2 display on cell surface of LLC1-HER2 (left) and CT26_HER2 (right) by FACS analysis; an unrelated antibody was used as negative control. (B) The graphic shows Tmem173 (transcript ID ENSMUST00000115728.4) gene organization. Full and empty boxes represent, respectively, coding and untranslated exons. The positions of guide RNAs used for CRISPR/Cas9 genome editing to generate Sting knockout cancer cell lines are indicated by arrows. (C) Western blot analysis of Sting protein in CT26-HER2, LLC1_HER2 and their Sting knockout cell lines counterparts. Gamma tubulin was used as standard. (D) PCR screening of CT26-HER2_SKO and LLC1_HER2_SKO cell lines to assess the absence of eGFP and Cas9 residues in genomic DNA. Cas9/eGFP-encoding vector was used as positive control (C+). Genomic DNA from parental CT26-HER2 and LLC-HER2 cell lines was used as negative control (C−). (E) Cell doubling per day were assessed for Sting wild-type (grey lines) and Sting knockout (black lines) LLC1 (left) and CT26 (right) cell lines. The differences in cell doubling were calculated by Student’s t-test and were not statistically significant (Ns) to each passage.

