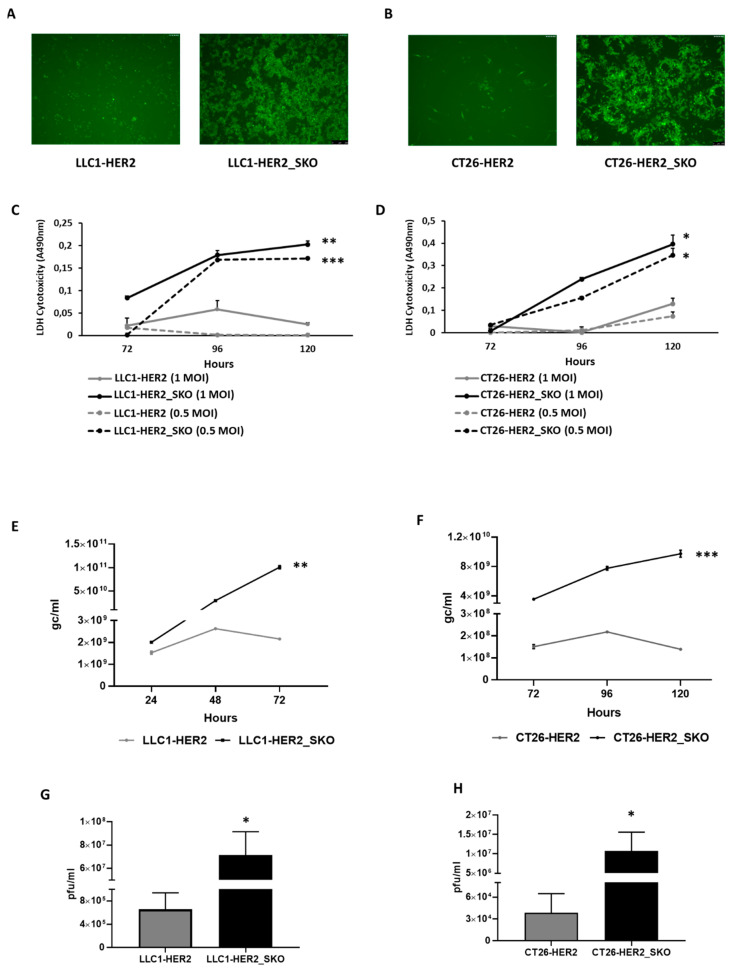
Figure 2.
Comparison of viral effectiveness in Sting knockout vs. parental wild-type cancer cell lines. (A,B) Spread of eGFP-encoding R-LM113 was evaluated by fluorescence microscopy in STING wild-type and knockout LLC1 (5×) (A) and CT26 (10×) (B) cell lines. (C) The lytic activity of R-LM113 was evaluated by extracellular LDH (lactate dehydrogenase) release in cell supernatants over the time course of infection (72, 96 and 120 h) in LLC1-HER2 (grey lines) and LLC1-HER2_SKO (black lines) at two different concentrations of viral particles (1 multiplicity of infection (MOI) continuous lines and 0.5 MOI dashed lines). (D) The same experiments performed in panel C were recapitulated in CT26-HER2 and CT26-HER2_SKO. All the infections were performed as biological replicates. The statistical significances for experiments described in panel c and d were calculated by Student’s t-test comparing MOI-matched Sting wild-type vs. knockout cell lines. The p-values were 0.00115 and 0.000219, respectively, for 1 and 0.5 MOI in panel C; 0.01583, 0.008543, respectively, for 1 and 0.5 MOI in panel D. (E,F) Evaluation of viral replication of R-LM113 in Sting wild-type and knockout LLC1 (E) and CT26 (F) infected with 0.3 PFU/cell. The qPCR-TaqMan analysis revealed the genome copies per mL (gc/mL) produced by the virus over time (24, 48, 72 h for LLC1 and 72, 96, 20 h for CT26). The statistical significances for experiments described in panel e and f were calculated by Student’s t-test comparing Sting wild-type vs. knockout cell lines. The p-values calculated on biological replicates were 0.0013 for LLC1 cell line and 0.0005 for CT26 cell line. (G,H) Analysis of the R-LM113 viral titers obtained in Sting wild-type and knockout LLC1 (G) and CT26 (H) cells infected with 0.3 PFU/cell. Plaque assay was performed as biological replicate. The statistical significance for experiments described in panel g and h was calculated by Student’s t-test comparing Sting wild-type vs. knockout cell lines. The p-values were 0.038 for LLC1 cell line and 0.02 for CT26 cell line. p < 0.05 *; p < 0.005 **; p < 0.0005 ***.

