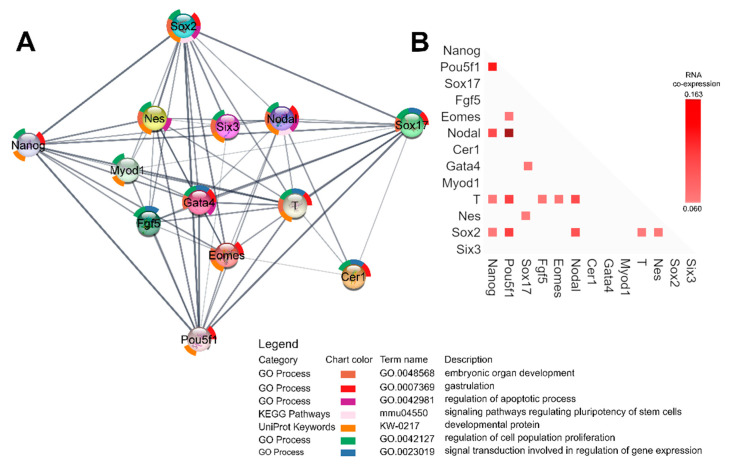
Figure 8.
(A) STRING functional gene analysis using Cytoscape. Each node represents a protein product of an investigated gene. Lines denote protein–protein interactions, with line thickness being indicative of evidence strength for a predicted interaction. (B) RNA co-expression, by STRING v11. Each node represents evidence of intersecting genes’ RNA co-expression. Scores are represented with lighter hues of red for weaker and darker hues for stronger.

