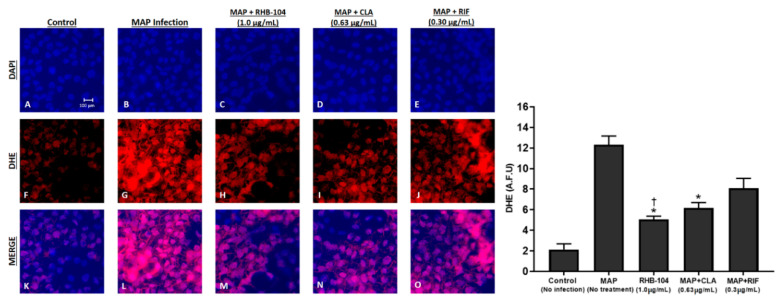
Figure 8.
Oxidative stress levels demonstrated by DHE fluorescence staining assay following treatment with RHB-104 and its major components in MAP infected Caco-2 Monolayers. Total nuclei are stained with DAPI in blue (A–E). DHE positive cells are stained in red (F–J), and merged cells are presented in pink (K–O). The histogram shows quantitative corrected DHE fluorescence integrated density in control and treated groups. * p value < 0.05 compared to no treatment control. † p value < 0.05 compared to no treatment control and MAP + RIF values.

