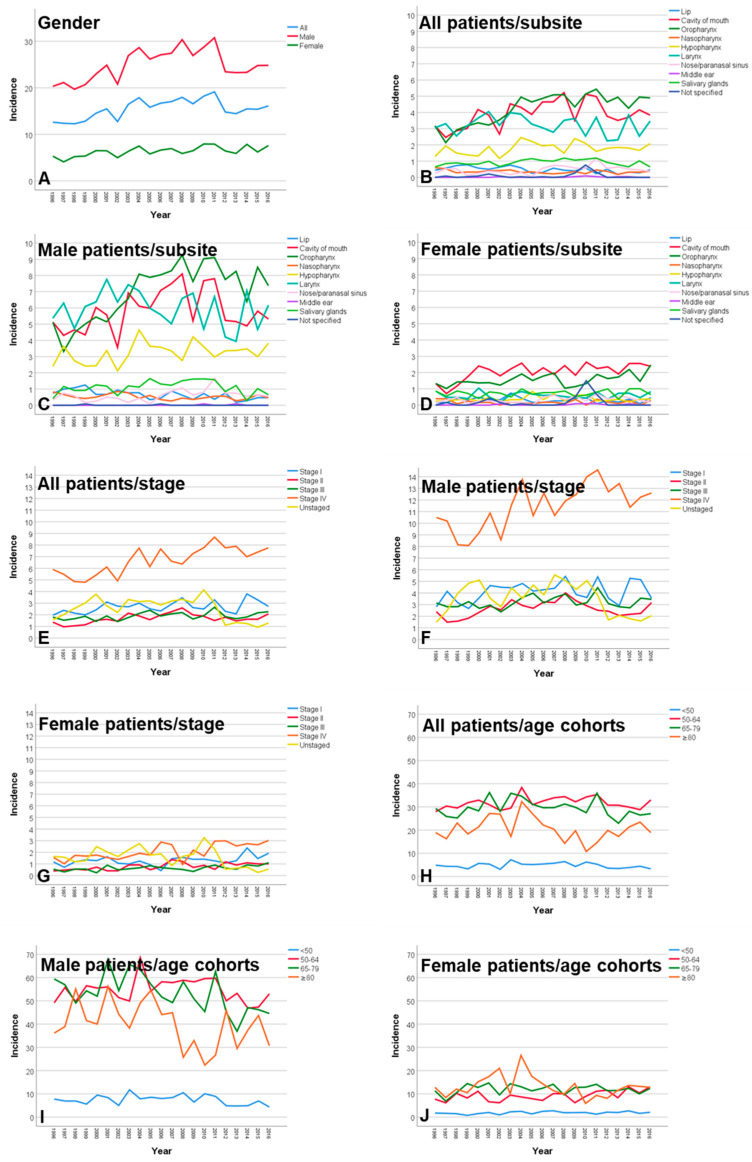
Figure 3.
Incidence rates of head and neck cancer per 100,000 population in Thuringia per year from 1996 to 2016. (A) Related to gender. (B) Related to subsite in all patients. (C) Related to subsite in male patients. (D) Related to subsite in female patients. (E) Related to tumor stage in all patients. (F) Related to tumor stage in male patients. (G) Related to tumor stage in female patients. (H) Related to age groups in all patients. (I) Related to age groups in male patients. (J) Related to age groups in female patients.

