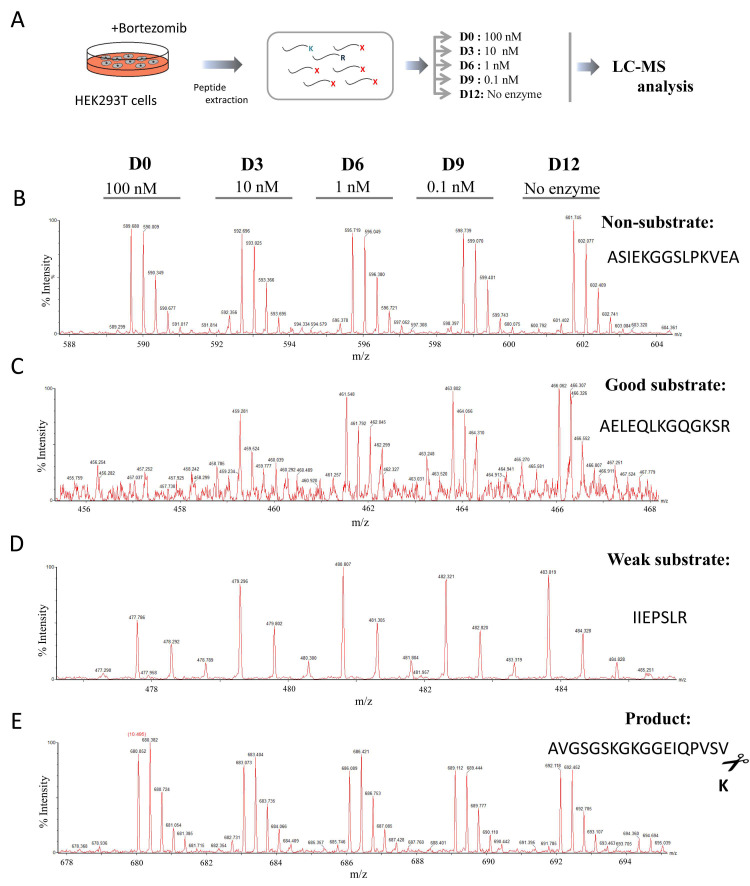
Figure 3.
Quantitative peptidomics analysis of CPZ substrate specificity using peptides extracted from HEK293T cells treated with bortezomib. (A) Quantitative peptidomics analysis scheme and (B–E) representative results. After incubation of the peptides with CPZ at different concentrations, the individual samples were labeled with one of five stable isotopic TMAB tags (D0 for 100 nM CPZ; D3 for 10 nM CPZ; D6 for 1 nM CPZ; D9 for 0.1 nM CPZ; D12 for samples without enzyme). All five reactions were pooled and analyzed by LC-MS. Representative examples are shown for (B) non-substrates, (C) good substrates, (D) weak substrates and (E), products of CPZ.

