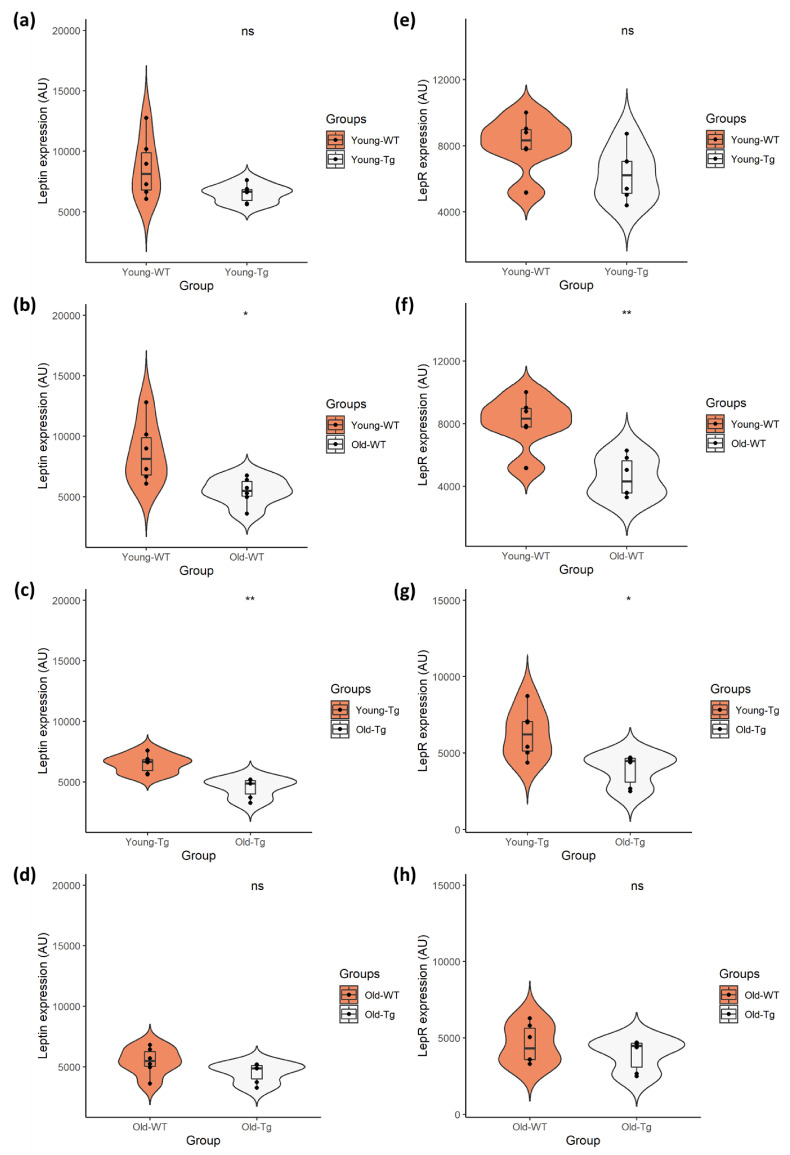
Figure 2.
Quantitative analysis of neuronal leptin and LepR expression in young (10–12 week) and old (48–52 week) 5XFAD (Tg) mice and wild-type (WT) controls. Independent t-test analysis of (a) neuronal leptin and (e) LepR expression between the young-WT and young-Tg revealed no significant differences. However, there was significant difference in expression of (b) leptin and (f) LepR between the young-WT and old-WT groups. This was also observed with the (c) leptin and (g) LepR expression amongst young-Tg and old-Tg mice. However, there was no significant difference in (d) leptin or (h) LepR expression between the old-WT and old-Tg mice. Data presented as violin plots using an independent t-test, with statistical significance indicated as * p < 0.05 and ** p < 0.01 between groups.

