Figure 7.
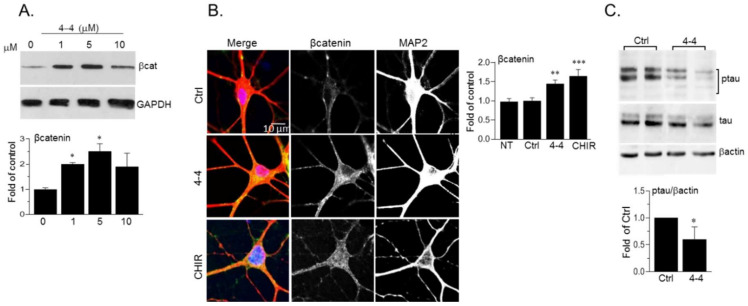
Biological activity of 4-4. (A) SH-SY5Y cells were treated with 4-4 for 4 h and levels of cytoplasmic β-catenin were determined by immunoblot analysis. Densitometry analysis is shown on the lower panel. Results are mean of three independent experiments ± SEM * p < 0.05 by one-way ANOVA with Dunnett’s post hoc test (B) Hippocampal mouse neurons were treated with 4-4 (5 μM), or CHIR99021 (CHIR, 10 μM) for 4 h. Cells were co-stained with anti-β-catenin and anti-MAP2 antibodies. Images show overlapping β-catenin (green) and MAP2 (red) staining along with respective split channels (shown in grey). The β-catenin signal was evaluated by Image J Colocalization-finder plugin. Results present the mean of 60 cells ± SEM, ** p < 0.01, *** p < 0.0001 by one-way ANOVA with Dunnett’s post hoc test. NT- non treated. (C) Hippocampal mouse neurons were treated with 4-4 (20 μM) for 4 h. Levels of phosphorylated tau (Ser 396), tau, and β-actin were determined by immunoblot analysis. Bar graph represents densitometry analysis of ptau/βactin and results are mean of three independent experiments ± SEM using Student’s t-test. * p < 0.05. For all panels, Ctrl or 0 concentration represents cells treated with vehicle (DMSO/1%Tween 80 at matched dilutions—1:2000–4000).

