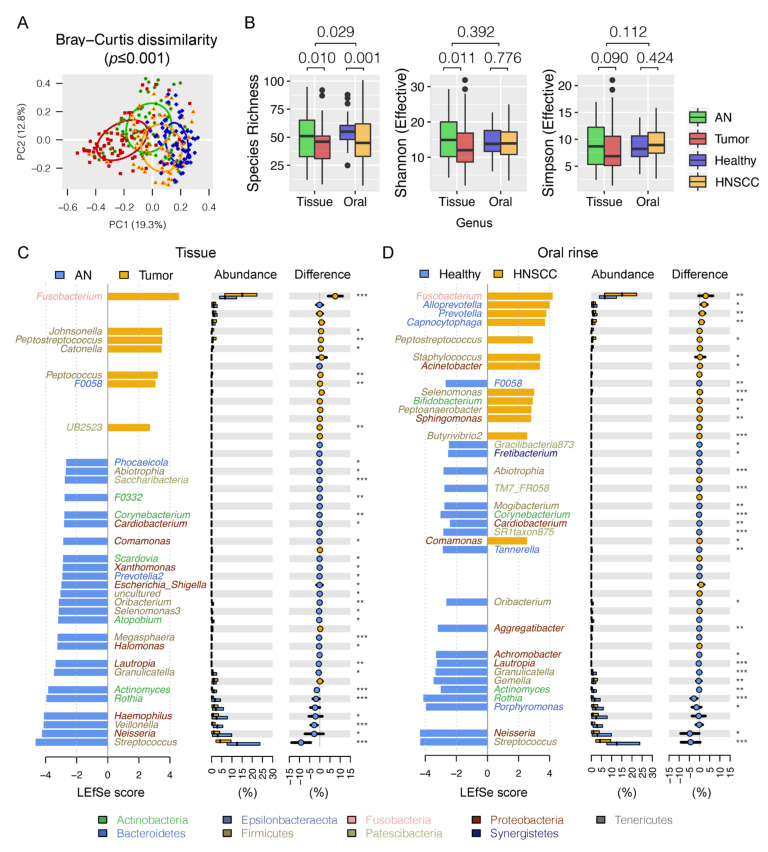
Figure 1.
Oral microbiota dysbiosis associated with head and neck squamous cell carcinomas (HNSCCs). (A) Principal coordinates plot using Bray–Curtis dissimilarity. (B) Comparison of oral microbiota diversity summarized at the genus level. (C) Comparison of oral microbiota between HNSCC tumor (tumor) and adjacent normal (AN) tissues, with bacterial genera that best discriminated HNSCCs and controls by a linear discriminant analysis (LDA) for effect size (LEfSe). The bar length represents log10 LDA score. Difference in the relative abundance tested by pairwise Tukey HSD post hoc is shown on the right panel. (D) Comparison of oral microbiota between HNSCC oral rinses and healthy subjects. Adjusted Mann–Whitney U-test p value is marked with * if ≤ 0.05, ** ≤ 0.01, or *** ≤ 0.001.

