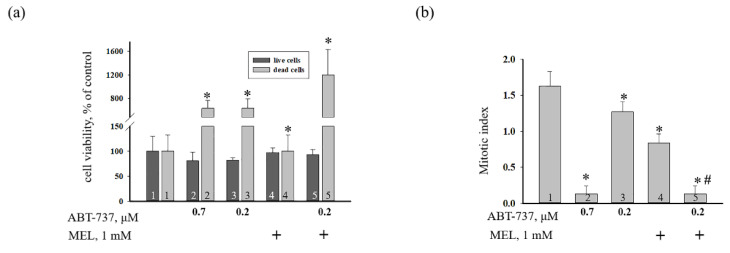
Figure 2.
The effect of MEL and ABT-737 on the viability and proliferation of HL-60 cells. Cells were treated with 0.7 µM ABT-737 (column 2), and 0.2 µM ABT-737 (columns 3) and 1 mM MEL (column 4), and MEL in combination with 0.2 µM ABT-737 (column 5); untreated cells (control, column 1). (a) Cell viability in % relative to the control. (b) Mitotic index was calculated in the presence of 0.7 µM ABT-737 (column 2), and 0.2 µM ABT-737 (columns 3) and 1 mM MEL (column 4), and MEL in combination with 0.2 µM ABT-737 (column 5); untreated cells (control, column 1). “+” means the presence of MEL. The data are presented as the means ± S.D. of six separate experiments. * p < 0.05 significant difference in values in comparison with the control, # p < 0.05 significant difference in values compared to the value obtained after the addition of ABT-737 alone (0.2 µM, column 3).

