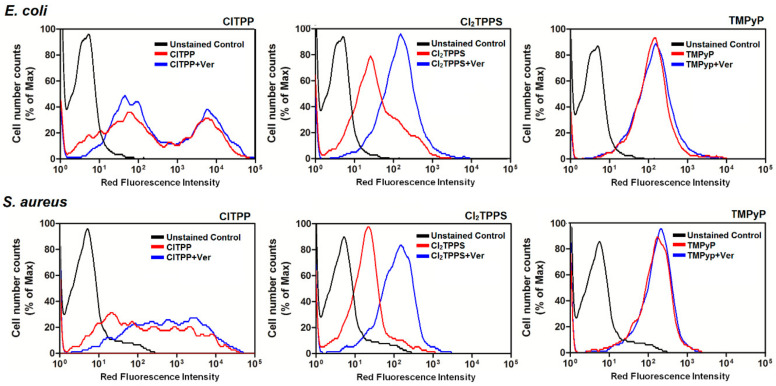
Figure 13.
Cellular uptake was determined in E. coli (upper) and S. aureus (lower panel) based on the red fluorescence of the selected porphyrin (ClTPP, Cl2TPPS, and TMPyP) using flow cytometry. Histograms of the fluorescence intensities of the unstained control (black line), a photosensitizer (red), and PS uptake after the addition of verapamil (blue).

