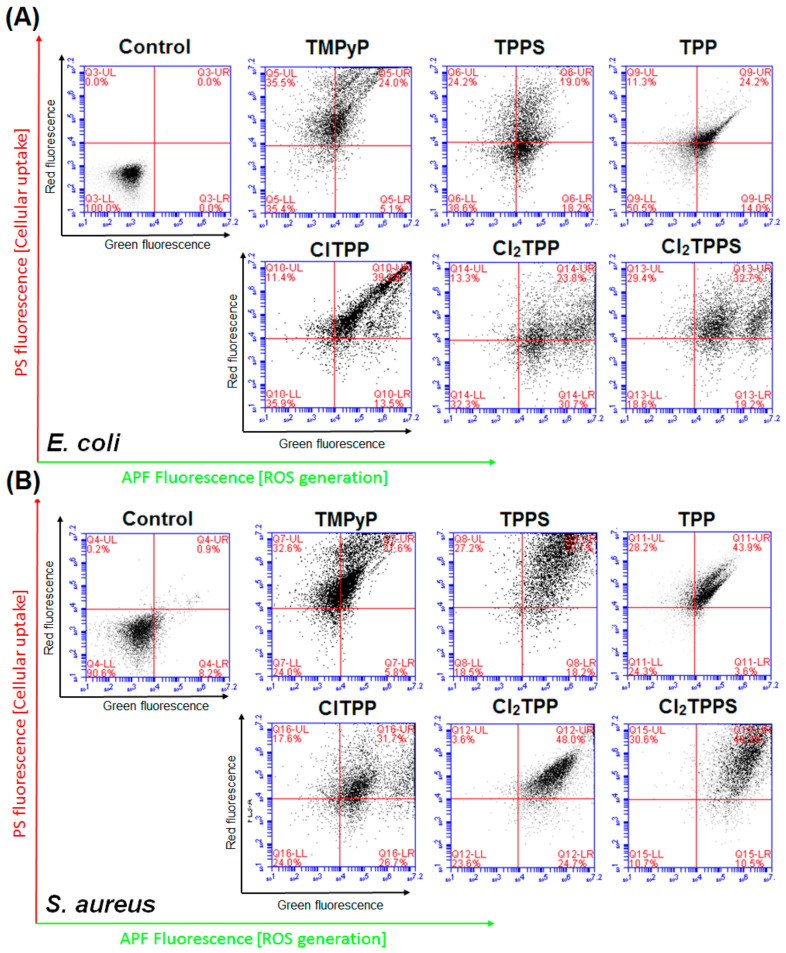
Figure 14.
Flow cytometry analysis of reactive oxygen species (ROS) generation in vitro in (A) E. coli and (B) S. aureus. After incubation of bacteria with PS (2 h) and APF (2 h), the cells were irradiated with a sublethal light dose 10 J/cm2. The APF fluorescence signal monitored the level of ROS in the green channel, and the cellular uptake (red porphyrin fluorescence) was detected as an increased red fluorescence signal.

