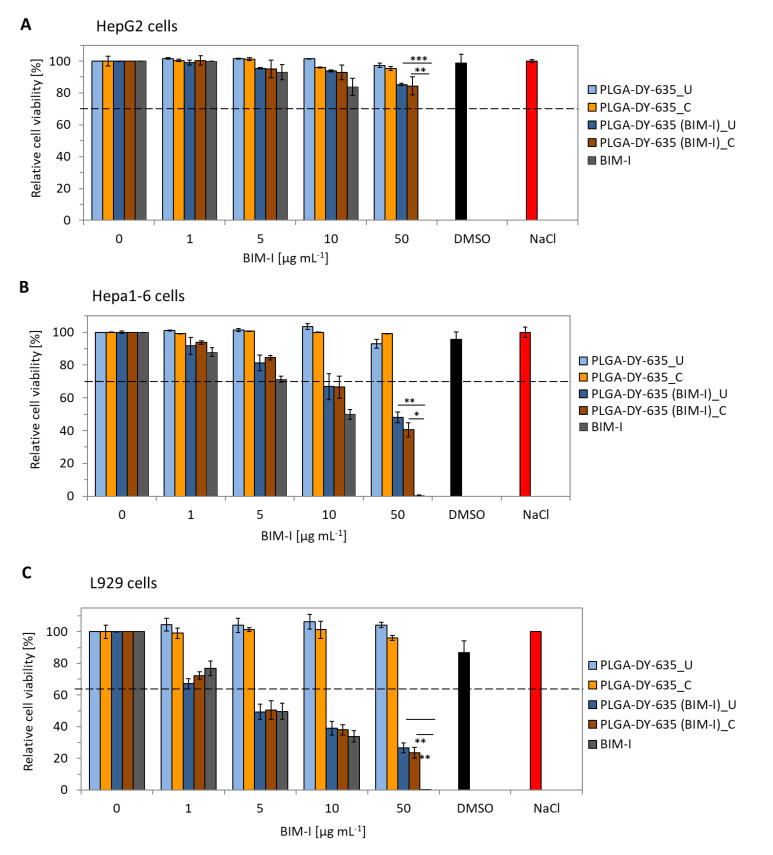
Figure 4.
Cell viability of the NPs tested in HepG2 cells (A), Hepa1-6 cells, (B) and L929 cells (C); U denotes NPs purified via ultrafiltration; C denotes NPs purified via crossflow filtration. For statistical analysis, a two-tailed t-test was used, where p < 0.02 (*); p < 0.01 (**); p < 0.001 (***); n = 3.

