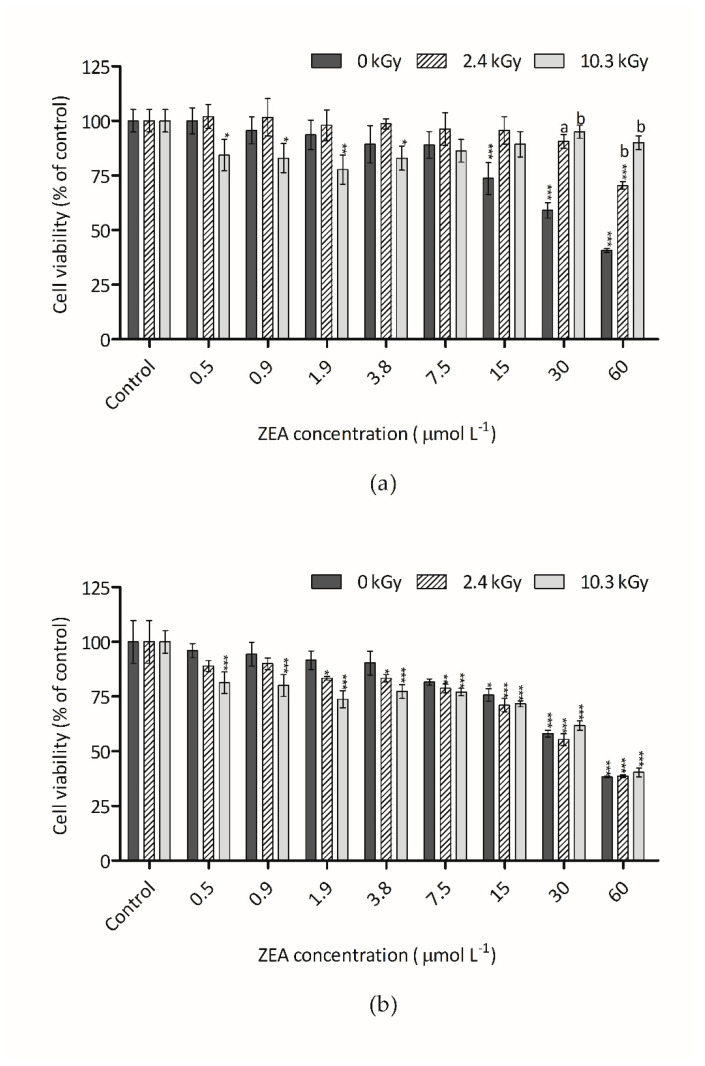
Figure 2.
Effect of ZEA samples on HepG2 cell viability assessed by the Alamar Blue assay: (a) Irradiated and non-irradiated water-dissolved ZEA samples; (b) Irradiated and non-irradiated dried ZEA samples. Bars represent the mean and their standard error (SEM) of at least three independent repetitions. Significant differences with respect to the vehicle control (one-way rmANOVA, Dunnett’s Post-hoc test) are indicated as follows: * (p < 0.05), ** (p < 0.01), *** (p < 0.001). Statistically significant differences with respect to non-irradiated sample (0 kGy) and the irradiated samples (2.4 kGy and 10.3 kGy) (one-way rmANOVA, Dunnett’s Post-hoc test) are indicated as follows: a (p < 0.01), b (p < 0.001), no letter (no statistical differences).

