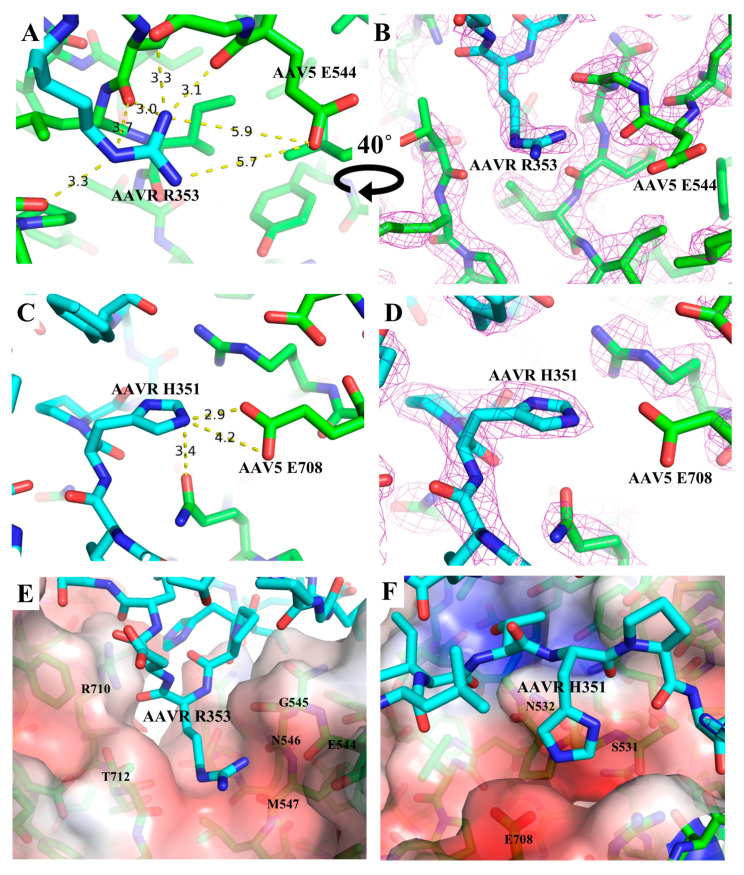
Figure 2.
AAV5-PKD1 interactions with PKD1 carbon atoms in cyan and AAV5 carbon atoms in green. The EM map is shown at the 2 σ-level as violet mesh on panels B and D. (A,B) PKD1 R353 is shown with distances (Å) to neighboring atoms of AAV5. (C,D) PKD1 H351 is shown, highlighting potential hydrogen bonding interactions with AAV5. (E,F) The solvent accessible surface of AAV5 is colored according its electric potential as calculated using the APBS adaptive Poisson-Boltzmann solver [33]. Electro-negative surfaces (red), formed by charged side chains and polar backbone carbonyls, form pockets on AAV5 into which AAV5 R353 (E) and H351 (F) are accommodated.

