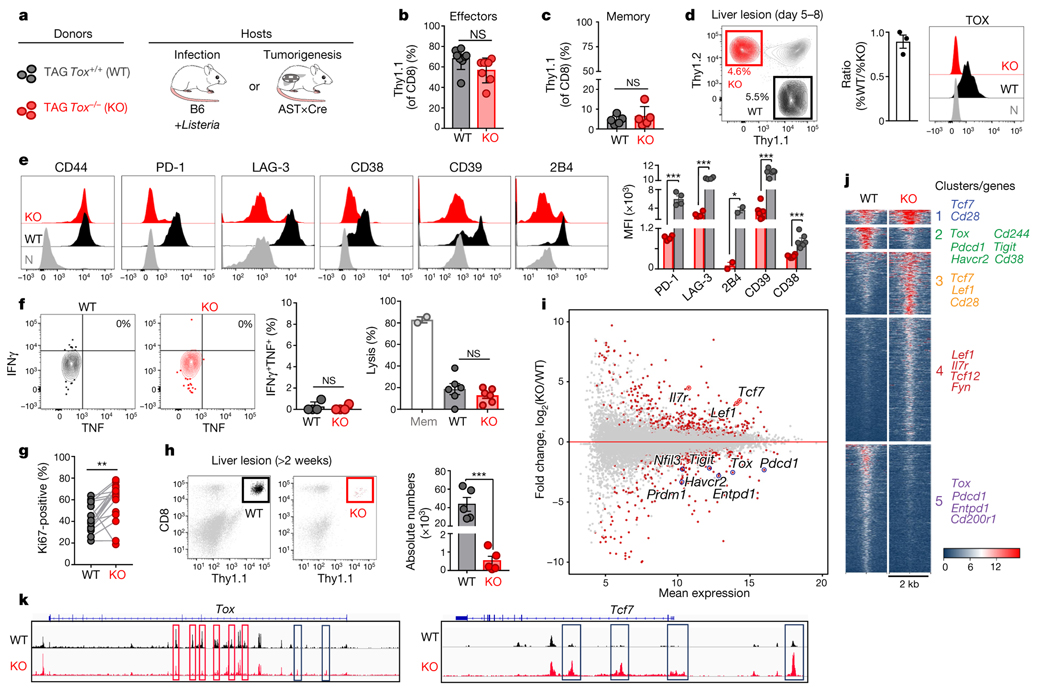
Fig. 4 |. Phenotypic, functional, transcriptional and epigenetic analysis of TOX-deficient T cells.
a, Experimental scheme. b, c, Percentage of wild-type (WT; black) and knockout (KO; red) Thy1.1+ effector (b) or memory (c) TCRTAG cells isolated from spleens 7 days (b) or 3 weeks (c) after LmTAG infection, respectively. For b, n = 8 (WT); n = 7 (KO); for c, n = 5 (WT); n = 5 (KO); two independent experiments. d, Left, wild-type and knockout TCRTAG cells isolated from malignant liver lesions 5–8 days after transfer into AST×Cre-ERT2 (Thy1.1+Thy1.2+) mice. Middle, ratio of the percentage of wild-type and knockout T cells. Right, TOX expression of liver-infiltrating wild-type and knockout TCRTAG cells; naive TCRTAG cells are shown in grey as a control. e, Expression profiles of liver-infiltrating wild-type and knockout TCRTAG cells 8–10 days after adoptive transfer. Naive TCRTAG cells are shown in grey. Data are representative of more than five independent experiments (n = 4 (PD-1/LAG-3); n = 2 (2B4); n = 6 (CD39/CD38)). f, Left, intracellular IFNγ and TNF production of wild-type (n = 4) and TOX-knockout (n = 4) TCRTAG cells isolated 10 days after transfer from liver lesions of AST×Cre mice. Right, specific lysis of TAG-peptide-pulsed EL4 cells in chromium release assays by wild-type (n = 6) and knockout (n = 6) TCRTAG cells isolated and flow-sorted from liver tumour lesions. Results from two independent experiments. Memory (Mem) TCRTAG cells are shown as a control. g, Percentage of Ki67-positive wild-type and knockout TCRTAG cells from malignant liver lesions 6–8 days after transfer into AST×Cre mice. Data are from three independent experiments. h, Wild-type and knockout donor TCRTAG cells 19 days after transfer in liver tumours (WT, n = 5; KO, n = 5). Data are representative of two independent experiments. In b–h, each symbol represents an individual mouse. i, MA plot of RNA-seq data. Significantly DEGs are in red. j, Chromatin accessibility of wild-type and knockout TCRTAG cells. Each row represents one peak (differentially accessible between wild-type and knockout; FDR < 0.05) displayed over a 2-kb window centred on the peak summit; regions were clustered with k-means clustering. Genes associated with peaks within individual clusters are highlighted. k, ATAC-seq signal profiles across the Tox and Tcf7 loci. Peaks uniquely lost or gained in knockout TCRTAG cells are highlighted in red or blue, respectively. Data are mean ± s.e.m. *P ≤ 0.05, **P ≤ 0.01, ***P ≤ 0.001, two-sided Student’s t-test.

