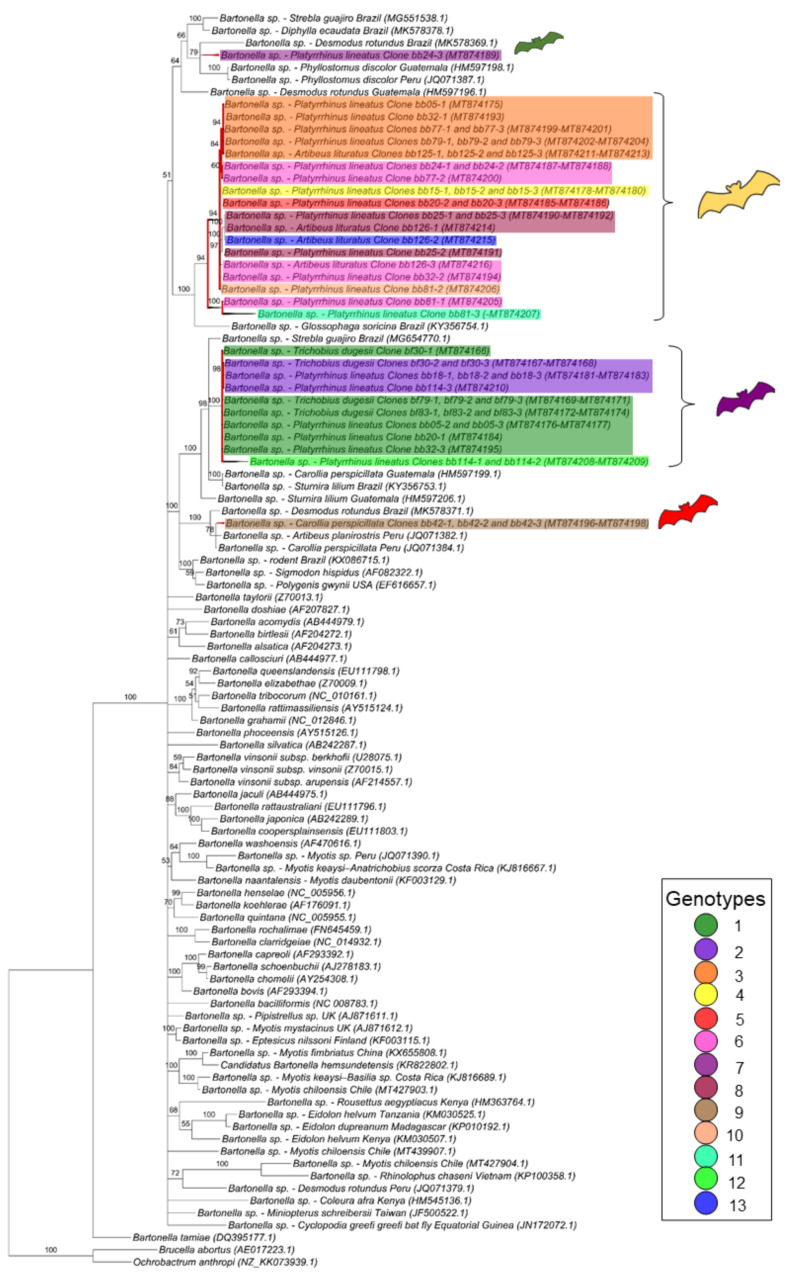
Figure 2.
Phylogenetic tree based on an alignment of 790 bp-length of Bartonella spp. gltA sequences, using the Bayesian Inference method and TVM+I+G as the evolutionary model. Numbers at nodes correspond to the posterior probability value support. Each sequence-clone or group of sequences-clone are highlighted according to their respective genotype. The colored bats are positioned according to the groups found in the genealogy network. Each sample is designated with the type of sample (bb = bat blood and bf = bat fly) followed by the referred animal and clone numbers.

