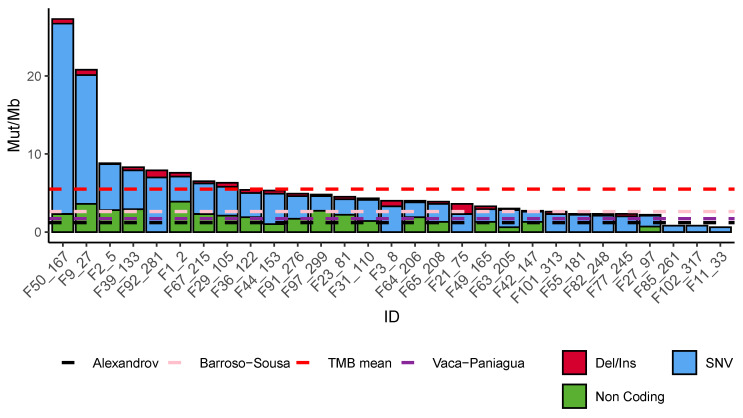
Figure 2.
Tumor mutation burden (TMB) on each sample according to the type of variant. The type of mutation is indicated: Indels and deletions (red), single nucleotide variations (SNVs) (blue), and non-coding (green). The red dotted line is the mean TMB of our cohort and the black and purple dotted line is the TMB mean found by Alexandrov (2013), Vaca–Paniagua (2015), and Barroso–Sousa (2020) [49,50,51].

