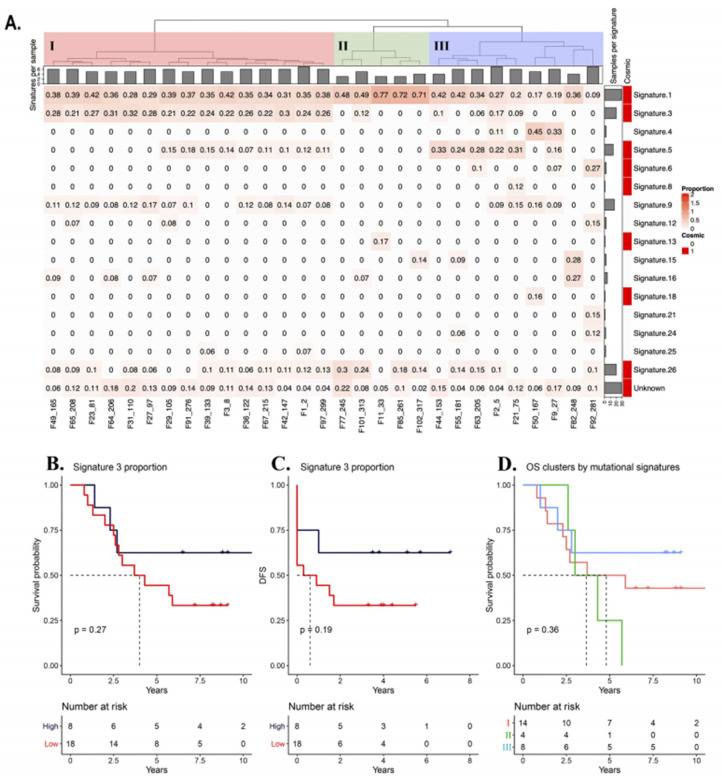
Figure 4.
Tumor genomic distribution according to mutational signature profile and overall survival probability of each group. (A) Heatmap of the mutational signatures clustered with the Ward’s method (see Materials and Methods section). Three different mutational signature groups were identified and defined as I, II and III. (B) Overall survival probability of according to signature 3 proportion (high versus low). (C) Disease-free survival probability according to signature 3 proportion (high versus low). (D) Overall survival probability of the three mutational signature groups.

