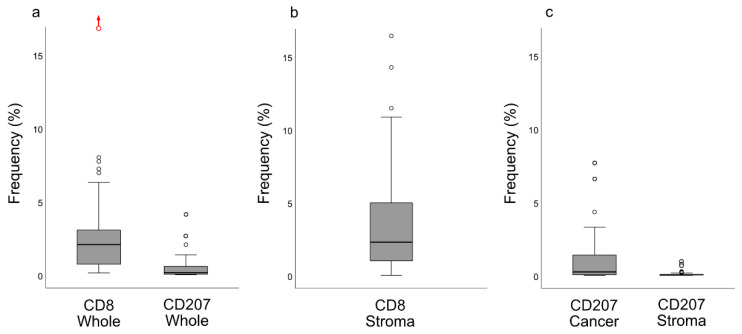
Figure 4.
CD8 and CD207 frequency (%) presented as boxplots (median and IQR with whiskers denoting 1.5 IQR and outliers as circles) for the whole biopsies (a) as well as for selected areas: (b) CD8 and (c) CD207. There was a difference between CD207 ratios between areas of cancer cells and the surrounding stroma (p < 0.0001). In (a), an extreme outlier (frequency: 24%), deemed an accurate observation, is indicated with a red circle and an upwards pointing red arrow. Abbreviation: IQR = interquartile range.

