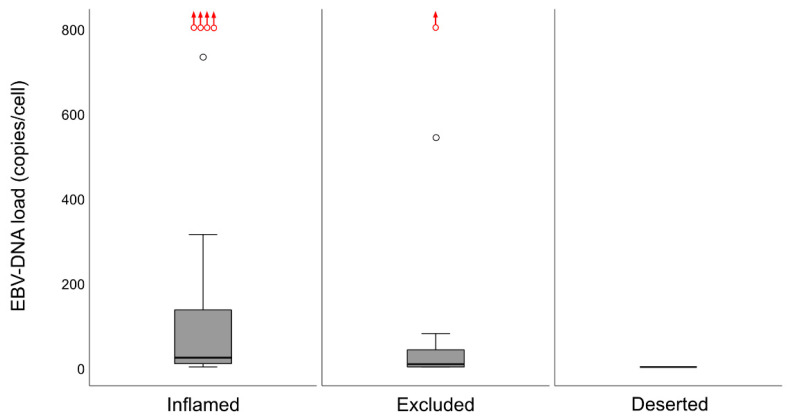
Figure 8.
Differences in intralesional EBV DNA load (copies/cell) for immune phenotypes are shown (medians and IQR with whiskers denoting 1.5 IQR and outliers as circles). A marked difference in DNA load was present between the “inflamed” and “deserted” phenotypes (p = 0.00034). The differences between “inflamed” and “excluded” and between “excluded” and “deserted” were not significant, though a trend was seen (p = 0.055 and p = 0.079, respectively). Higher load outliers (range 1237–94617 copies/cell) are indicated with red circles and upwards-pointing red arrows. Abbreviation: EBV = Epstein–Barr virus.

