
FIGURE 1.
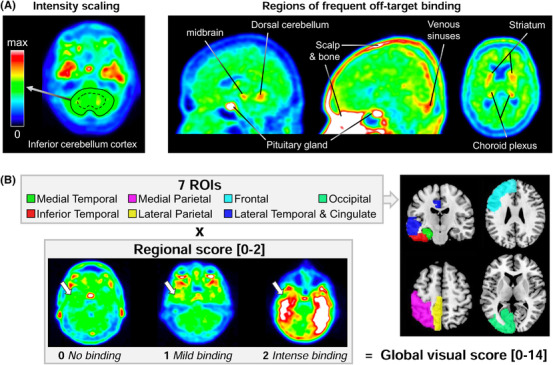
Overview of the visual read approach and global score. A, The image intensity has to be manually adjusted by each reader, fixing the value of the inferior cerebellar cortex value to the mid‐range of the color scale (green area). For both visual indices (global visual score and flortaucipir pattern), readers considered tracer binding beyond the common areas of off‐target (non‐specific) binding, as illustrated here in amyloid‐negative controls. B, The global visual score is based on seven regions of interest (ROIs), only shown on the left to simplify the display, each scored on a 0 to 2 scale (white arrows illustrate the scale applied to the inferior temporal lobe), resulting in a 0 to 14 global scale