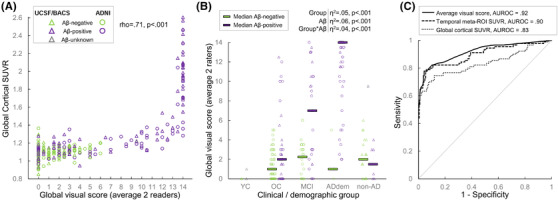
FIGURE 3.

Global visual score: association with global cortical standardized uptake value ratio (SUVR), clinical diagnosis, and amyloid status. A, Associations between flortaucipir cortical SUVR and global visual score (average of both readers). See Figure S2 in supporting information for similar plots using each reader's score or each cohort separately. The scatter plot shows a non‐linear relationship and differences in dynamic range between the two variables: SUVR values appear little related to the visual score in the low range, while the visual score reaches a ceiling for cortical SUVR >1.6. B, Association of clinical diagnosis and amyloid status on the global visual score (average of both readers). See Figure S3 in supporting information for similar plots using each reader's score. The YC group was excluded from the general linear model results described on top (overall R2 = .68). YC, young controls; OC, older controls; MCI, patients with a clinical diagnosis of mild cognitive impairment; ADdem, patients with a clinical diagnosis of Alzheimer's disease dementia; non‐AD, patients with a clinical diagnosis of non‐AD neurodegenerative syndrome. Clinical diagnoses were independent from amyloid beta (Aβ) status. C, Receiver operating curve (ROC) testing on the ability of the average global visual score and two SUVR measures to distinguish Aβ‐positive MCI/ADdem (n = 90) versus all other participants (n = 184). AUROC, area under the receiver operating curve
