
FIGURE 4.
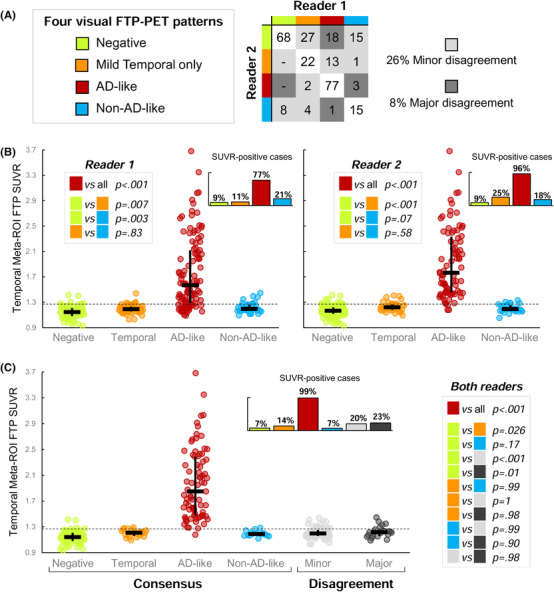
Visual flortaucipir patterns: inter‐reader agreement and association with temporal meta‐region of interest (ROI) standardized uptake value ratio (SUVR). A, Inter‐reader agreement based on the 274 cases read by both readers (see Results section and Figure S4 in supporting information for statistics or intra‐rater agreement). Numbers in the table indicate raw numbers of cases for each combination of patterns, not percentages. B, Association between temporal meta‐ROI FTP‐SUVR and visual patterns defined by each reader in the 274 cases. The dotted line represents the independently defined 1.27 threshold; small bar graph inserts indicate the proportion of case above the 1.27 threshold within each visual pattern group. Black bars show median and interquartile range. P values correspond to post hoc tests following significant Kruskal Wallis test (see Result section). C, Similar to panel (B), but distinguishing cases for which the two readers assigned similar or different visual patterns. The right panel shows the discriminative characteristics of the visual AD‐like pattern to separate the two groups.