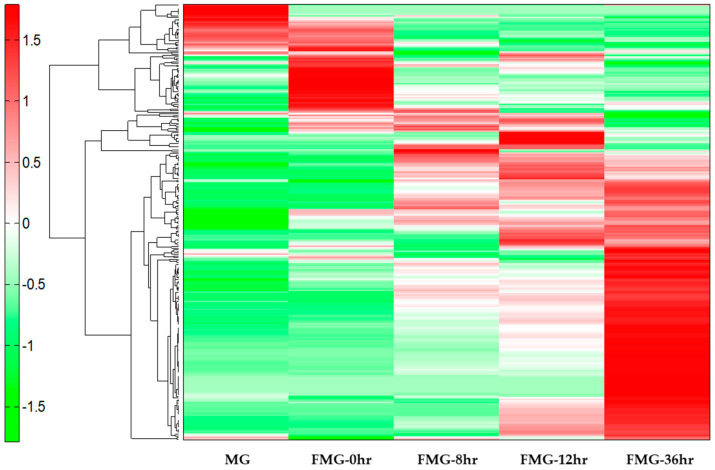
Figure 1.
An hierarchical cluster analysis (HCA) heatmap comparing the metabolites from the mixed grains (MG) during fermentation. The x-axis shows MG (a grain mixture before steaming), fermented mixed grains (FMG)-0hr (a mixture of grain steamed for 30 min at 100 °C), FMG-8hr (a mixture of grain fermented for 8 h), FMG-12hr (a mixture of grain fermented for 12 h), and FMG-36hr (a mixture of grain fermented for 36 h) for each metabolite. The green and red colors indicate lower and higher contents of the metabolites, respectively.

