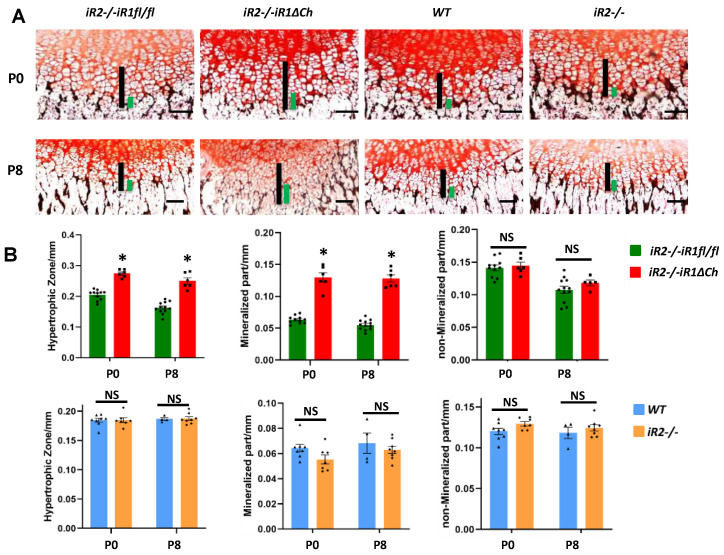
Figure 3.
Von Kossa staining uncovers a selective enlargement of the mineralized hypertrophic chondrocytes in iR2−/−iR1∆Ch compared to controls. (A) Sections from P0 and P8 mice that were not demineralized were stained with von Kossa stain to mark the zone of mineralized hypertrophic chondrocytes adjacent to the chondro-osseous junction in black. The length of the zone of mineralized hypertrophic chondrocytes, defined as hypertrophic chondrocytes adjacent to the black von Kossa-stained material (indicated by green bars) and of the total zone of hypertrophic chondrocytes (indicated by black bars) were enlarged in iR2−/−iR1∆Ch mice compared to iR2−/−iR1fl/fl controls or compared to samples from age-matched WT or iR2−/− mice. (B) Quantification of the size of the zone hypertrophic chondrocytes and of the zone of mineralized hypertrophic chondrocytes confirmed the enlargement of both in iR2−/−iR1∆Ch mice compared to iR2−/−iR1fl/fl controls, whereas there was no significant difference in the length of the zone of non-mineralized von Kossa-negative hypertrophic chondrocytes (top panels). There was no significant difference in the length of either of these parameters between samples from age matched WT and iR2−/− mice (lower panels). * indicates a p-value of < 0.05, which was considered statistically significant, whereas NS indicates no significant difference. The scale bar indicates 100 µm. At least 4 samples from separate animals were used for each time point and genotype (WT P0, n = 8; P8, n = 4; for iR2−/− P0, n = 7; P8, n = 8; for iR2−/−iR1fl/fl, P0, n = 11; P8, n = 12; for iR2−/−iR1∆Ch, P0, n = 6; P8, n = 6). The error bars correspond to the SEM.

