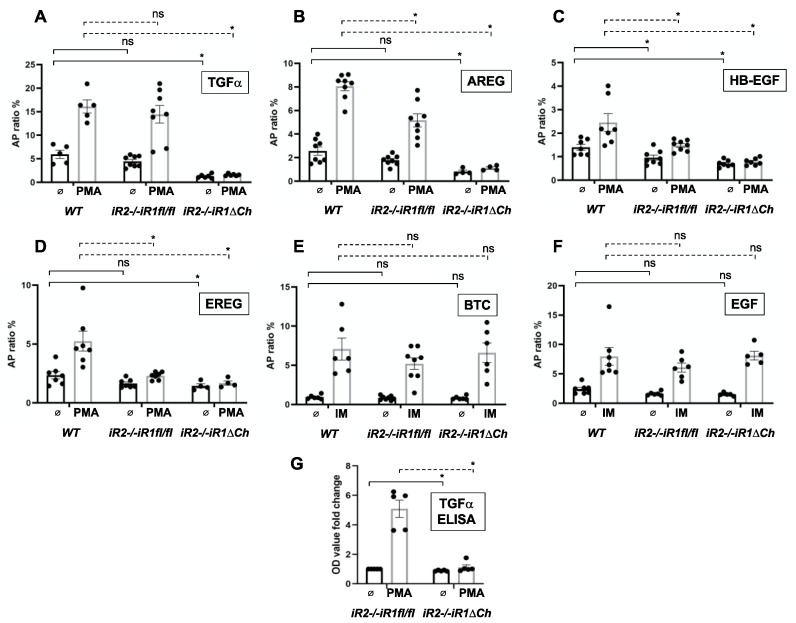
Figure 6.
Constitutive and stimulated shedding of ligands of the EGFR from primary chondrocytes. Primary chondrocyte cultures from WT, iR2−/−iR1fl/fl and iR2−/−iR1∆Ch mice were transfected with alkaline phosphatase-tagged ligands of the EGFR (A–F) or not transfected (G) and then incubated for 1 h with or without 25 ng/mL of the Phorbol 12-myristate 13-acetate (PMA), which strongly stimulates shedding of the ADAM17 substrates TGFα (A), amphiregulin (AREG, B), heparin-binding EGF (HB-EGF, C), epiregulin (EREG, D), and endogenous TGFα (G) or with 2.5 µM of the ionophore ionomycin (IM), which stimulates both ADAM10 and ADAM17, in order to enhance the shedding of the ADAM10 substrates betacellulin (BTC, E) and epidermal growth factor (EGF, F). In all cases, the WT chondrocytes served as positive control for stimulated shedding of each EGFR-ligand. Constitutive and stimulated shedding of TGFα was not affected in iR2−/−iR1fl/fl compared to WT controls, but strongly reduced in iR2−/−iR1∆Ch chondrocytes (A). Stimulated shedding of AREG (B), HB-EGF (C) and EREG (D) was significantly reduced in iR2−/−iR1fl/fl compared to WT controls, and in all cases both stimulated and constitutive shedding was strongly reduced in chondrocytes from iR2−/−iR1∆Ch mice. Constitutive and ionomycin-stimulated shedding of the two ADAM10 substrates BTC (E) and EGF (F) was not significantly affected in either of the mutant chondrocyte cultures compared to WT controls (E,F). Finally, constitutive and PMA-stimulated shedding of endogenous TGFα was significantly reduced in iR2−/−iR1∆Ch chondrocytes compared to WT controls (G). Statistical significance, as determined by the student’s T-test, is indicated by * (p < 0.05), whereas NS indicates that the samples are not significantly different. The two samples compared by statistical analysis are indicted by brackets with solid lines for constitutive shedding and with dotted lines for stimulated shedding. The AP-levels in the corresponding chondrocyte lysates as a control for relative expression levels is shown in Supplementary Figure S9. The error bars indicate SEM.

