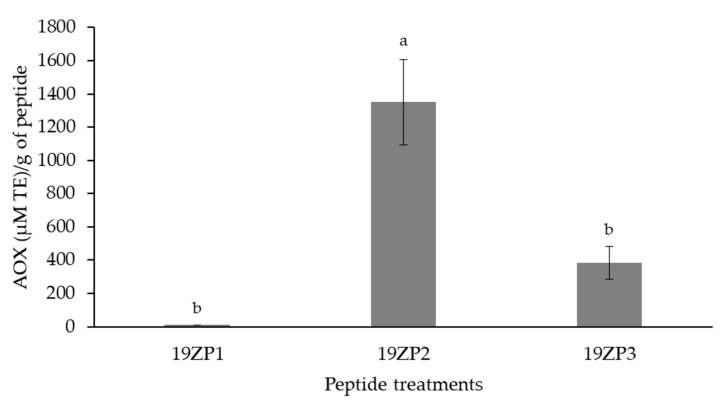
Figure 6.
Evaluation of the antioxidant capacity (AOX) of the peptides using the oxygen radical absorbance capacity (ORAC) assay. Results are expressed as mean values ± standard deviation; n = 3. Superscript letters represent statistical differences among samples. Statistical difference was determined by Tukey’s test (p < 0.05). TE: Trolox equivalents

