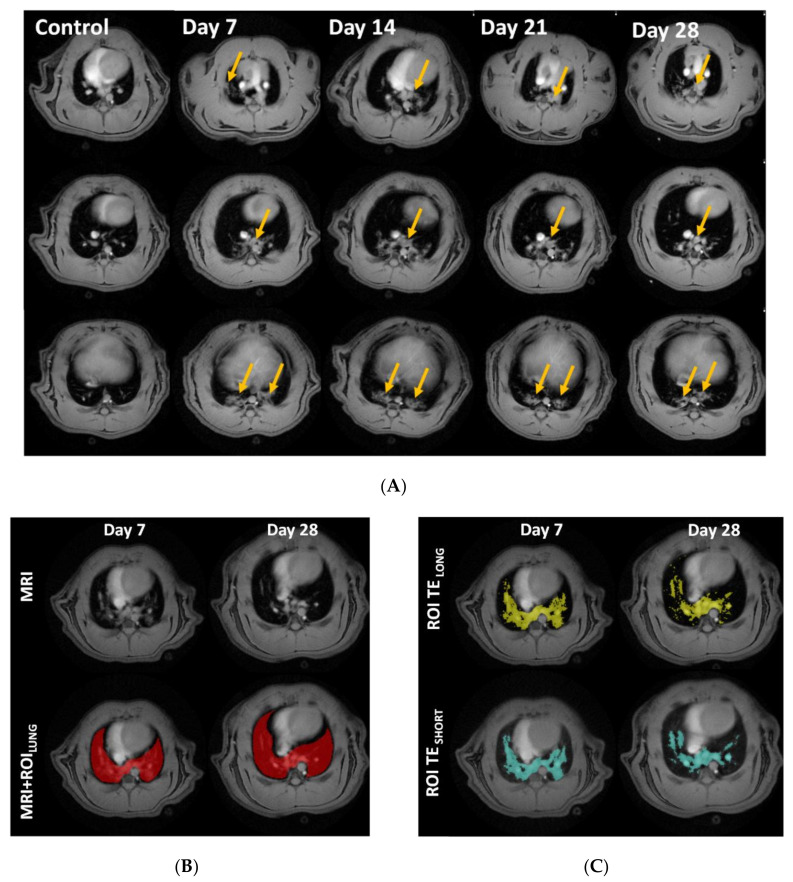
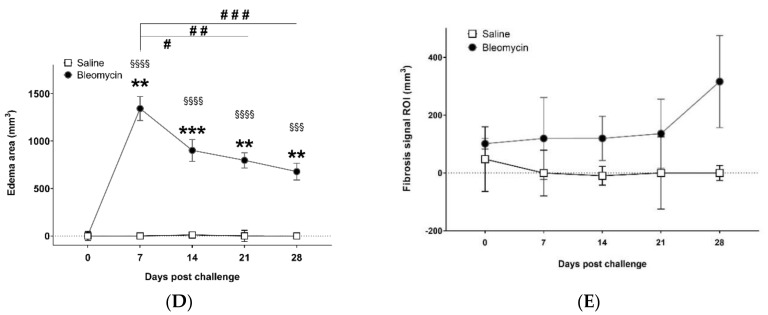
Figure 3.
Longitudinal magnetic resonance imaging (MRI) in Group I, during 28 days of bleomycin-induced lung injury. (A) Representative MRI images of lungs from rats challenged by i.t. administration of bleomycin (or saline as controls), on day 7, 14, 21, and 28 post-challenge. Yellow arrows point out identified lesions (B) MRI defined Lung-ROIs and (C) UTESHORT and UTELONG defined regions in yellow and blue, respectively. Quantification of the lesion signal assessed by the two different MRI sequences was calculated for (D) “edema” signal indicating peak inflammation in bleomycin challenged rats at day 7, while (E) the calculated “tissue” signal appears to peak at day 28.


