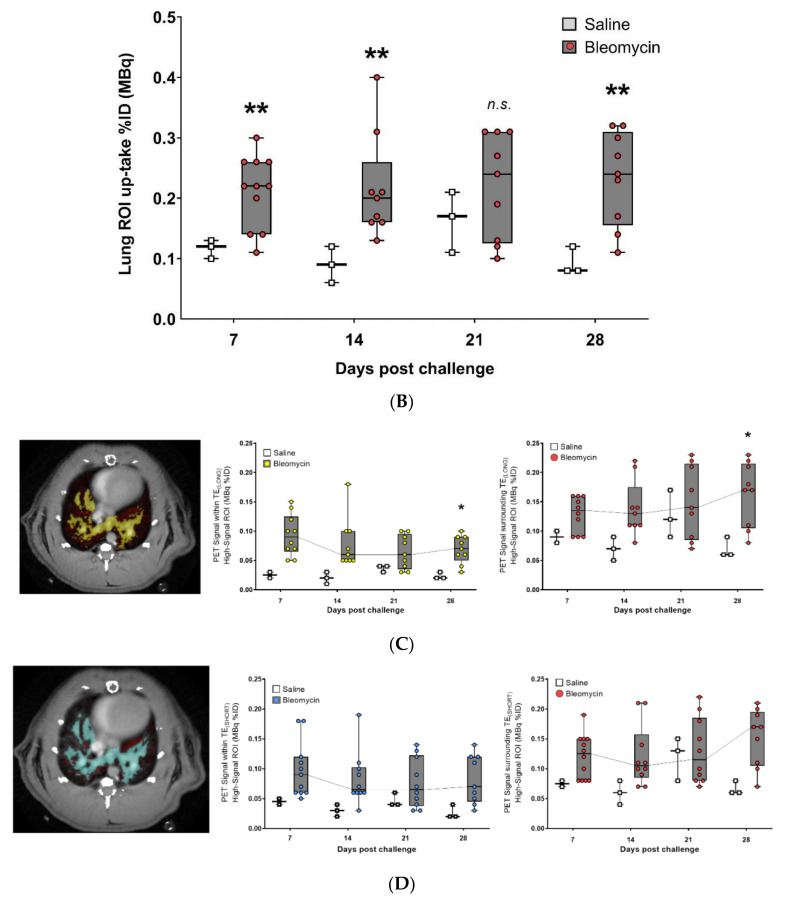
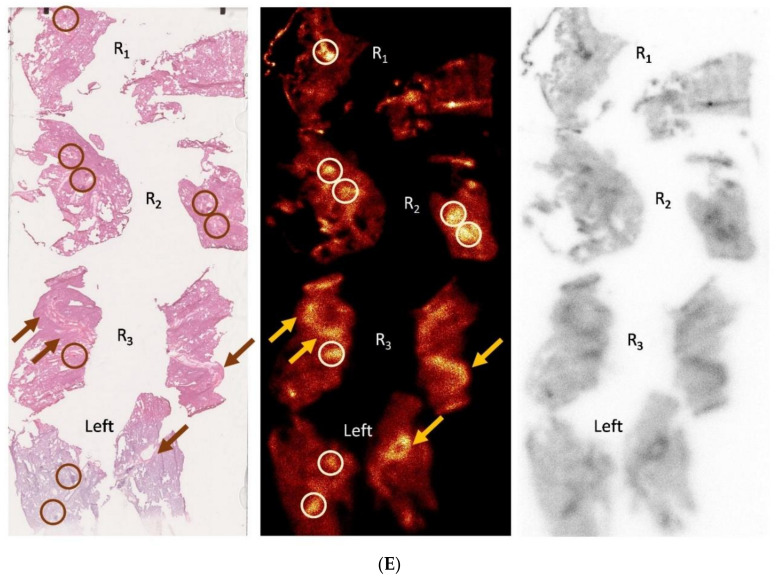
Figure 4.
Longitudinal PET imaging in Group I, during 28 days of bleomycin-induced lung injury, using the novel PET tracer for assessment of non-cross-linked Collagen-I. (A) Representative PET images of lungs from rats challenged by i.t. administration of bleomycin (or saline as controls) on day 7, 14, 21, and 28 post-challenge. (B) Quantification of the total lung tissue signal uptake expressed as fraction uptake (total lung uptake of the injected dose [%ID]). The PET signal was assessed in different compartments, defined as high signal regions based on the TESHORT and TELONG, sequences from obtained MRI scans. (C) PET signal uptake from TELONG defined lesions (yellow area) and surrounding area within the total Lung-ROI. (D) PET signal uptake within the TESHORT defined lesions (blue) and surrounding area within the total Lung-ROI. (E) Autoradiography was performed in few of the animals to assess microscopic tracer uptake directly after the PET scan. One time point (day 21) from the bleomycin-challenged group is presented here. Lungs R1–R4 are Right lung lobes from the top section and downwards. Left referring to the left lung lobe. Enhanced signal uptake of CBP-Cu64 is indicated by arrows (in the case of long streaks of signal) or encircled (in the case of focused area), where also fibrotic tissue is observed in close proximity to healthy tissue and vessel-airway presence.


